
Advertisement
- China
- /
- Communications
- /
- SZSE:300167
Little Excitement Around Shenzhen Division Co.,Ltd.'s (SZSE:300167) Revenues As Shares Take 27% Pounding
To the annoyance of some shareholders, Shenzhen Division Co.,Ltd. (SZSE:300167) shares are down a considerable 27% in the last month, which continues a horrid run for the company. For any long-term shareholders, the last month ends a year to forget by locking in a 57% share price decline.
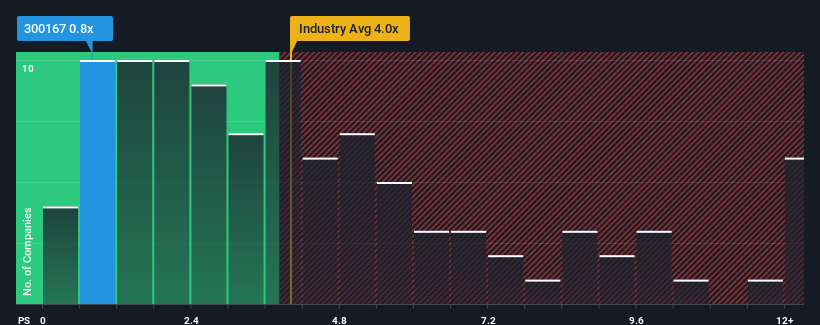
Following the heavy fall in price, Shenzhen DivisionLtd may be sending very bullish signals at the moment with its price-to-sales (or "P/S") ratio of 0.8x, since almost half of all companies in the Communications industry in China have P/S ratios greater than 4x and even P/S higher than 7x are not unusual. Nonetheless, we'd need to dig a little deeper to determine if there is a rational basis for the highly reduced P/S.
See our latest analysis for Shenzhen DivisionLtd
What Does Shenzhen DivisionLtd's Recent Performance Look Like?
The revenue growth achieved at Shenzhen DivisionLtd over the last year would be more than acceptable for most companies. It might be that many expect the respectable revenue performance to degrade substantially, which has repressed the P/S. If that doesn't eventuate, then existing shareholders have reason to be optimistic about the future direction of the share price.
Want the full picture on earnings, revenue and cash flow for the company? Then our free report on Shenzhen DivisionLtd will help you shine a light on its historical performance.What Are Revenue Growth Metrics Telling Us About The Low P/S?
The only time you'd be truly comfortable seeing a P/S as depressed as Shenzhen DivisionLtd's is when the company's growth is on track to lag the industry decidedly.
If we review the last year of revenue growth, the company posted a terrific increase of 21%. The strong recent performance means it was also able to grow revenue by 95% in total over the last three years. So we can start by confirming that the company has done a great job of growing revenue over that time.
Comparing that to the industry, which is predicted to deliver 45% growth in the next 12 months, the company's momentum is weaker, based on recent medium-term annualised revenue results.
In light of this, it's understandable that Shenzhen DivisionLtd's P/S sits below the majority of other companies. It seems most investors are expecting to see the recent limited growth rates continue into the future and are only willing to pay a reduced amount for the stock.
What Does Shenzhen DivisionLtd's P/S Mean For Investors?
Having almost fallen off a cliff, Shenzhen DivisionLtd's share price has pulled its P/S way down as well. Generally, our preference is to limit the use of the price-to-sales ratio to establishing what the market thinks about the overall health of a company.
As we suspected, our examination of Shenzhen DivisionLtd revealed its three-year revenue trends are contributing to its low P/S, given they look worse than current industry expectations. At this stage investors feel the potential for an improvement in revenue isn't great enough to justify a higher P/S ratio. Unless the recent medium-term conditions improve, they will continue to form a barrier for the share price around these levels.
You should always think about risks. Case in point, we've spotted 3 warning signs for Shenzhen DivisionLtd you should be aware of, and 2 of them are a bit unpleasant.
If these risks are making you reconsider your opinion on Shenzhen DivisionLtd, explore our interactive list of high quality stocks to get an idea of what else is out there.
New: Manage All Your Stock Portfolios in One Place
We've created the ultimate portfolio companion for stock investors, and it's free.
• Connect an unlimited number of Portfolios and see your total in one currency
• Be alerted to new Warning Signs or Risks via email or mobile
• Track the Fair Value of your stocks
Have feedback on this article? Concerned about the content? Get in touch with us directly. Alternatively, email editorial-team (at) simplywallst.com.
This article by Simply Wall St is general in nature. We provide commentary based on historical data and analyst forecasts only using an unbiased methodology and our articles are not intended to be financial advice. It does not constitute a recommendation to buy or sell any stock, and does not take account of your objectives, or your financial situation. We aim to bring you long-term focused analysis driven by fundamental data. Note that our analysis may not factor in the latest price-sensitive company announcements or qualitative material. Simply Wall St has no position in any stocks mentioned.
About SZSE:300167
Shenzhen DivisionLtd
Engages in the research and development, and sale of smart video and IoT core technology products and solutions primarily in China.
Mediocre balance sheet with questionable track record.
Market Insights

Advertisement
Community Narratives
MicroVision will explode future revenue by 380.37% with a vision towards success
Fair Value US$60.00|98.4% undervalued
TH
Community Contributor
The Indispensable Artery for a New North American Economy
Fair Value CA$132.87|1.3% undervalued
TI
Community Contributor