
Advertisement
- China
- /
- Electronic Equipment and Components
- /
- SZSE:300131
There's No Escaping Shenzhen Yitoa Intelligent Control Co.,Ltd.'s (SZSE:300131) Muted Revenues Despite A 29% Share Price Rise
Shenzhen Yitoa Intelligent Control Co.,Ltd. (SZSE:300131) shareholders would be excited to see that the share price has had a great month, posting a 29% gain and recovering from prior weakness. Looking further back, the 14% rise over the last twelve months isn't too bad notwithstanding the strength over the last 30 days.
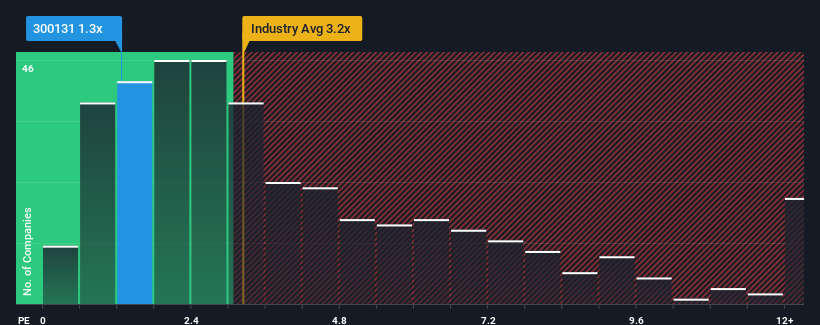
In spite of the firm bounce in price, Shenzhen Yitoa Intelligent ControlLtd's price-to-sales (or "P/S") ratio of 1.3x might still make it look like a buy right now compared to the Electronic industry in China, where around half of the companies have P/S ratios above 3.2x and even P/S above 6x are quite common. Nonetheless, we'd need to dig a little deeper to determine if there is a rational basis for the reduced P/S.
Check out our latest analysis for Shenzhen Yitoa Intelligent ControlLtd
How Shenzhen Yitoa Intelligent ControlLtd Has Been Performing
Shenzhen Yitoa Intelligent ControlLtd has been doing a decent job lately as it's been growing revenue at a reasonable pace. Perhaps the market believes the recent revenue performance might fall short of industry figures in the near future, leading to a reduced P/S. If that doesn't eventuate, then existing shareholders may have reason to be optimistic about the future direction of the share price.
Want the full picture on earnings, revenue and cash flow for the company? Then our free report on Shenzhen Yitoa Intelligent ControlLtd will help you shine a light on its historical performance.Do Revenue Forecasts Match The Low P/S Ratio?
The only time you'd be truly comfortable seeing a P/S as low as Shenzhen Yitoa Intelligent ControlLtd's is when the company's growth is on track to lag the industry.
If we review the last year of revenue growth, the company posted a worthy increase of 3.3%. Still, lamentably revenue has fallen 48% in aggregate from three years ago, which is disappointing. Therefore, it's fair to say the revenue growth recently has been undesirable for the company.
Weighing that medium-term revenue trajectory against the broader industry's one-year forecast for expansion of 25% shows it's an unpleasant look.
With this in mind, we understand why Shenzhen Yitoa Intelligent ControlLtd's P/S is lower than most of its industry peers. However, we think shrinking revenues are unlikely to lead to a stable P/S over the longer term, which could set up shareholders for future disappointment. There's potential for the P/S to fall to even lower levels if the company doesn't improve its top-line growth.
What Does Shenzhen Yitoa Intelligent ControlLtd's P/S Mean For Investors?
Despite Shenzhen Yitoa Intelligent ControlLtd's share price climbing recently, its P/S still lags most other companies. It's argued the price-to-sales ratio is an inferior measure of value within certain industries, but it can be a powerful business sentiment indicator.
Our examination of Shenzhen Yitoa Intelligent ControlLtd confirms that the company's shrinking revenue over the past medium-term is a key factor in its low price-to-sales ratio, given the industry is projected to grow. At this stage investors feel the potential for an improvement in revenue isn't great enough to justify a higher P/S ratio. Unless the recent medium-term conditions improve, they will continue to form a barrier for the share price around these levels.
Plus, you should also learn about these 2 warning signs we've spotted with Shenzhen Yitoa Intelligent ControlLtd (including 1 which is significant).
If companies with solid past earnings growth is up your alley, you may wish to see this free collection of other companies with strong earnings growth and low P/E ratios.
New: Manage All Your Stock Portfolios in One Place
We've created the ultimate portfolio companion for stock investors, and it's free.
• Connect an unlimited number of Portfolios and see your total in one currency
• Be alerted to new Warning Signs or Risks via email or mobile
• Track the Fair Value of your stocks
Have feedback on this article? Concerned about the content? Get in touch with us directly. Alternatively, email editorial-team (at) simplywallst.com.
This article by Simply Wall St is general in nature. We provide commentary based on historical data and analyst forecasts only using an unbiased methodology and our articles are not intended to be financial advice. It does not constitute a recommendation to buy or sell any stock, and does not take account of your objectives, or your financial situation. We aim to bring you long-term focused analysis driven by fundamental data. Note that our analysis may not factor in the latest price-sensitive company announcements or qualitative material. Simply Wall St has no position in any stocks mentioned.
About SZSE:300131
Shenzhen Yitoa Intelligent ControlLtd
Shenzhen Yitoa Intelligent Control Co.,Ltd.
Excellent balance sheet with slight risk.
Similar Companies
Market Insights

Advertisement
Community Narratives
MicroVision will explode future revenue by 380.37% with a vision towards success
Fair Value US$60.00|98.4% undervalued
TH
Community Contributor
The Indispensable Artery for a New North American Economy
Fair Value CA$132.87|1.3% undervalued
TI
Community Contributor