- China
- /
- Electronic Equipment and Components
- /
- SZSE:001308
Shenzhen KTC Technology Co., Ltd.'s (SZSE:001308) Stock's On An Uptrend: Are Strong Financials Guiding The Market?


Shenzhen KTC Technology's (SZSE:001308) stock is up by a considerable 20% over the past week. Given the company's impressive performance, we decided to study its financial indicators more closely as a company's financial health over the long-term usually dictates market outcomes. Specifically, we decided to study Shenzhen KTC Technology's ROE in this article.
Return on Equity or ROE is a test of how effectively a company is growing its value and managing investors’ money. In short, ROE shows the profit each dollar generates with respect to its shareholder investments.
See our latest analysis for Shenzhen KTC Technology
How To Calculate Return On Equity?
Return on equity can be calculated by using the formula:
Return on Equity = Net Profit (from continuing operations) ÷ Shareholders' Equity
So, based on the above formula, the ROE for Shenzhen KTC Technology is:
16% = CN¥1.1b ÷ CN¥7.0b (Based on the trailing twelve months to June 2024).
The 'return' is the yearly profit. Another way to think of that is that for every CN¥1 worth of equity, the company was able to earn CN¥0.16 in profit.
What Has ROE Got To Do With Earnings Growth?
So far, we've learned that ROE is a measure of a company's profitability. Based on how much of its profits the company chooses to reinvest or "retain", we are then able to evaluate a company's future ability to generate profits. Assuming everything else remains unchanged, the higher the ROE and profit retention, the higher the growth rate of a company compared to companies that don't necessarily bear these characteristics.
Shenzhen KTC Technology's Earnings Growth And 16% ROE
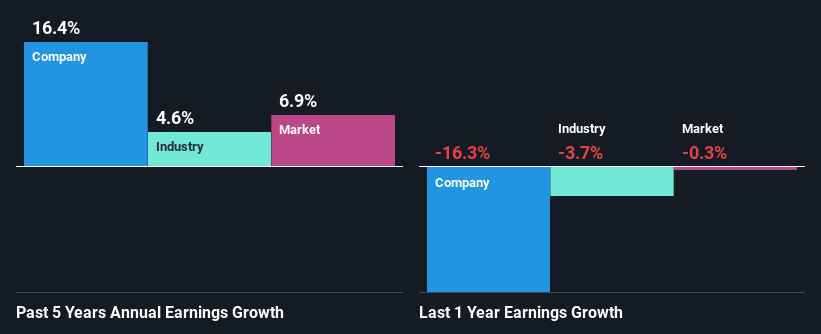
At first glance, Shenzhen KTC Technology seems to have a decent ROE. Especially when compared to the industry average of 6.4% the company's ROE looks pretty impressive. Probably as a result of this, Shenzhen KTC Technology was able to see a decent growth of 16% over the last five years.
We then compared Shenzhen KTC Technology's net income growth with the industry and we're pleased to see that the company's growth figure is higher when compared with the industry which has a growth rate of 4.6% in the same 5-year period.
The basis for attaching value to a company is, to a great extent, tied to its earnings growth. What investors need to determine next is if the expected earnings growth, or the lack of it, is already built into the share price. By doing so, they will have an idea if the stock is headed into clear blue waters or if swampy waters await. Has the market priced in the future outlook for 001308? You can find out in our latest intrinsic value infographic research report.
Is Shenzhen KTC Technology Using Its Retained Earnings Effectively?
With a three-year median payout ratio of 29% (implying that the company retains 71% of its profits), it seems that Shenzhen KTC Technology is reinvesting efficiently in a way that it sees respectable amount growth in its earnings and pays a dividend that's well covered.
While Shenzhen KTC Technology has been growing its earnings, it only recently started to pay dividends which likely means that the company decided to impress new and existing shareholders with a dividend.
Summary
Overall, we are quite pleased with Shenzhen KTC Technology's performance. Particularly, we like that the company is reinvesting heavily into its business, and at a high rate of return. Unsurprisingly, this has led to an impressive earnings growth. On studying current analyst estimates, we found that analysts expect the company to continue its recent growth streak. To know more about the latest analysts predictions for the company, check out this visualization of analyst forecasts for the company.
New: Manage All Your Stock Portfolios in One Place
We've created the ultimate portfolio companion for stock investors, and it's free.
• Connect an unlimited number of Portfolios and see your total in one currency
• Be alerted to new Warning Signs or Risks via email or mobile
• Track the Fair Value of your stocks
Have feedback on this article? Concerned about the content? Get in touch with us directly. Alternatively, email editorial-team (at) simplywallst.com.
This article by Simply Wall St is general in nature. We provide commentary based on historical data and analyst forecasts only using an unbiased methodology and our articles are not intended to be financial advice. It does not constitute a recommendation to buy or sell any stock, and does not take account of your objectives, or your financial situation. We aim to bring you long-term focused analysis driven by fundamental data. Note that our analysis may not factor in the latest price-sensitive company announcements or qualitative material. Simply Wall St has no position in any stocks mentioned.
About SZSE:001308
Shenzhen KTC Technology
Engages in the research and development, production, and sales of smart display products in China.
Good value with adequate balance sheet.

