
Advertisement
- China
- /
- Electronic Equipment and Components
- /
- SZSE:000045
What Shenzhen Textile (Holdings) Co., Ltd.'s (SZSE:000045) 30% Share Price Gain Is Not Telling You
Those holding Shenzhen Textile (Holdings) Co., Ltd. (SZSE:000045) shares would be relieved that the share price has rebounded 30% in the last thirty days, but it needs to keep going to repair the recent damage it has caused to investor portfolios. Unfortunately, the gains of the last month did little to right the losses of the last year with the stock still down 13% over that time.
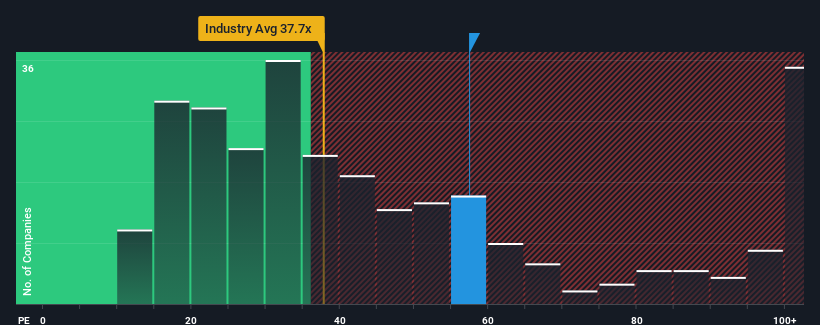
Since its price has surged higher, Shenzhen Textile (Holdings) may be sending very bearish signals at the moment with a price-to-earnings (or "P/E") ratio of 57.4x, since almost half of all companies in China have P/E ratios under 29x and even P/E's lower than 18x are not unusual. Nonetheless, we'd need to dig a little deeper to determine if there is a rational basis for the highly elevated P/E.
Shenzhen Textile (Holdings) certainly has been doing a great job lately as it's been growing earnings at a really rapid pace. It seems that many are expecting the strong earnings performance to beat most other companies over the coming period, which has increased investors’ willingness to pay up for the stock. If not, then existing shareholders might be a little nervous about the viability of the share price.
View our latest analysis for Shenzhen Textile (Holdings)
Is There Enough Growth For Shenzhen Textile (Holdings)?
In order to justify its P/E ratio, Shenzhen Textile (Holdings) would need to produce outstanding growth well in excess of the market.
If we review the last year of earnings growth, the company posted a terrific increase of 162%. The latest three year period has also seen an excellent 186% overall rise in EPS, aided by its short-term performance. Therefore, it's fair to say the earnings growth recently has been superb for the company.
Weighing that recent medium-term earnings trajectory against the broader market's one-year forecast for expansion of 41% shows it's about the same on an annualised basis.
In light of this, it's curious that Shenzhen Textile (Holdings)'s P/E sits above the majority of other companies. Apparently many investors in the company are more bullish than recent times would indicate and aren't willing to let go of their stock right now. Although, additional gains will be difficult to achieve as a continuation of recent earnings trends would weigh down the share price eventually.
What We Can Learn From Shenzhen Textile (Holdings)'s P/E?
The strong share price surge has got Shenzhen Textile (Holdings)'s P/E rushing to great heights as well. It's argued the price-to-earnings ratio is an inferior measure of value within certain industries, but it can be a powerful business sentiment indicator.
We've established that Shenzhen Textile (Holdings) currently trades on a higher than expected P/E since its recent three-year growth is only in line with the wider market forecast. Right now we are uncomfortable with the high P/E as this earnings performance isn't likely to support such positive sentiment for long. If recent medium-term earnings trends continue, it will place shareholders' investments at risk and potential investors in danger of paying an unnecessary premium.
Before you settle on your opinion, we've discovered 1 warning sign for Shenzhen Textile (Holdings) that you should be aware of.
You might be able to find a better investment than Shenzhen Textile (Holdings). If you want a selection of possible candidates, check out this free list of interesting companies that trade on a low P/E (but have proven they can grow earnings).
New: Manage All Your Stock Portfolios in One Place
We've created the ultimate portfolio companion for stock investors, and it's free.
• Connect an unlimited number of Portfolios and see your total in one currency
• Be alerted to new Warning Signs or Risks via email or mobile
• Track the Fair Value of your stocks
Have feedback on this article? Concerned about the content? Get in touch with us directly. Alternatively, email editorial-team (at) simplywallst.com.
This article by Simply Wall St is general in nature. We provide commentary based on historical data and analyst forecasts only using an unbiased methodology and our articles are not intended to be financial advice. It does not constitute a recommendation to buy or sell any stock, and does not take account of your objectives, or your financial situation. We aim to bring you long-term focused analysis driven by fundamental data. Note that our analysis may not factor in the latest price-sensitive company announcements or qualitative material. Simply Wall St has no position in any stocks mentioned.
About SZSE:000045
Shenzhen Textile (Holdings)
Engages in the research and development, production, sale, and marketing of polarizers in China and internationally.
Flawless balance sheet second-rate dividend payer.
Market Insights

Advertisement
Community Narratives
MicroVision will explode future revenue by 380.37% with a vision towards success
Fair Value US$60.00|98.4% undervalued
TH
Community Contributor
The Indispensable Artery for a New North American Economy
Fair Value CA$132.87|1.3% undervalued
TI
Community Contributor