- China
- /
- Electronic Equipment and Components
- /
- SHSE:688519
Nanya New Material Technology Co.,Ltd (SHSE:688519) Soars 27% But It's A Story Of Risk Vs Reward
Despite an already strong run, Nanya New Material Technology Co.,Ltd (SHSE:688519) shares have been powering on, with a gain of 27% in the last thirty days. Looking back a bit further, it's encouraging to see the stock is up 81% in the last year.
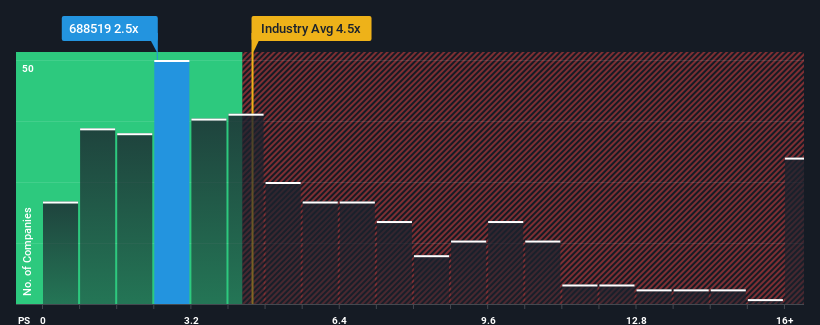
Although its price has surged higher, Nanya New Material TechnologyLtd may still be sending bullish signals at the moment with its price-to-sales (or "P/S") ratio of 2.5x, since almost half of all companies in the Electronic industry in China have P/S ratios greater than 4.5x and even P/S higher than 9x are not unusual. However, the P/S might be low for a reason and it requires further investigation to determine if it's justified.
View our latest analysis for Nanya New Material TechnologyLtd

What Does Nanya New Material TechnologyLtd's P/S Mean For Shareholders?
With revenue growth that's inferior to most other companies of late, Nanya New Material TechnologyLtd has been relatively sluggish. It seems that many are expecting the uninspiring revenue performance to persist, which has repressed the growth of the P/S ratio. If this is the case, then existing shareholders will probably struggle to get excited about the future direction of the share price.
Keen to find out how analysts think Nanya New Material TechnologyLtd's future stacks up against the industry? In that case, our free report is a great place to start.What Are Revenue Growth Metrics Telling Us About The Low P/S?
There's an inherent assumption that a company should underperform the industry for P/S ratios like Nanya New Material TechnologyLtd's to be considered reasonable.
If we review the last year of revenue growth, the company posted a worthy increase of 13%. Ultimately though, it couldn't turn around the poor performance of the prior period, with revenue shrinking 20% in total over the last three years. Accordingly, shareholders would have felt downbeat about the medium-term rates of revenue growth.
Shifting to the future, estimates from the one analyst covering the company suggest revenue should grow by 78% over the next year. With the industry only predicted to deliver 26%, the company is positioned for a stronger revenue result.
With this in consideration, we find it intriguing that Nanya New Material TechnologyLtd's P/S sits behind most of its industry peers. Apparently some shareholders are doubtful of the forecasts and have been accepting significantly lower selling prices.
The Final Word
Nanya New Material TechnologyLtd's stock price has surged recently, but its but its P/S still remains modest. While the price-to-sales ratio shouldn't be the defining factor in whether you buy a stock or not, it's quite a capable barometer of revenue expectations.
A look at Nanya New Material TechnologyLtd's revenues reveals that, despite glowing future growth forecasts, its P/S is much lower than we'd expect. The reason for this depressed P/S could potentially be found in the risks the market is pricing in. At least price risks look to be very low, but investors seem to think future revenues could see a lot of volatility.
It's always necessary to consider the ever-present spectre of investment risk. We've identified 2 warning signs with Nanya New Material TechnologyLtd (at least 1 which can't be ignored), and understanding them should be part of your investment process.
If companies with solid past earnings growth is up your alley, you may wish to see this free collection of other companies with strong earnings growth and low P/E ratios.
Valuation is complex, but we're here to simplify it.
Discover if Nanya New Material TechnologyLtd might be undervalued or overvalued with our detailed analysis, featuring fair value estimates, potential risks, dividends, insider trades, and its financial condition.
Access Free AnalysisHave feedback on this article? Concerned about the content? Get in touch with us directly. Alternatively, email editorial-team (at) simplywallst.com.
This article by Simply Wall St is general in nature. We provide commentary based on historical data and analyst forecasts only using an unbiased methodology and our articles are not intended to be financial advice. It does not constitute a recommendation to buy or sell any stock, and does not take account of your objectives, or your financial situation. We aim to bring you long-term focused analysis driven by fundamental data. Note that our analysis may not factor in the latest price-sensitive company announcements or qualitative material. Simply Wall St has no position in any stocks mentioned.
About SHSE:688519
Nanya New Material TechnologyLtd
Manufactures, designs, develops, and sells composite materials.
High growth potential with excellent balance sheet.
Market Insights
Community Narratives


