
Advertisement
- China
- /
- Communications
- /
- SHSE:688159
Shenzhen Neoway Technology Co.,Ltd.'s (SHSE:688159) Price Is Right But Growth Is Lacking After Shares Rocket 28%
Shenzhen Neoway Technology Co.,Ltd. (SHSE:688159) shares have had a really impressive month, gaining 28% after a shaky period beforehand. The annual gain comes to 129% following the latest surge, making investors sit up and take notice.
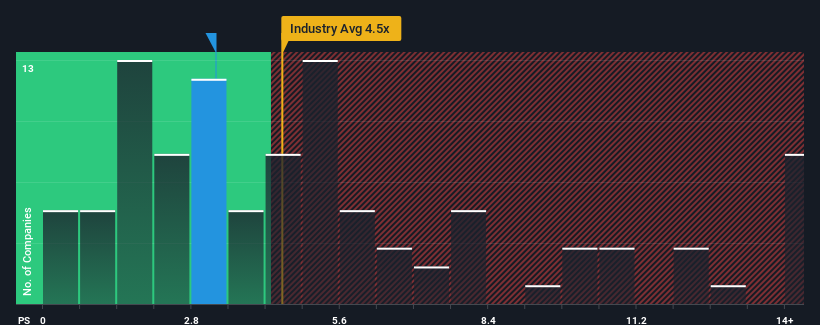
Although its price has surged higher, Shenzhen Neoway TechnologyLtd's price-to-sales (or "P/S") ratio of 3.3x might still make it look like a buy right now compared to the Communications industry in China, where around half of the companies have P/S ratios above 4.5x and even P/S above 7x are quite common. However, the P/S might be low for a reason and it requires further investigation to determine if it's justified.
See our latest analysis for Shenzhen Neoway TechnologyLtd
How Has Shenzhen Neoway TechnologyLtd Performed Recently?
Shenzhen Neoway TechnologyLtd certainly has been doing a great job lately as it's been growing its revenue at a really rapid pace. One possibility is that the P/S ratio is low because investors think this strong revenue growth might actually underperform the broader industry in the near future. Those who are bullish on Shenzhen Neoway TechnologyLtd will be hoping that this isn't the case, so that they can pick up the stock at a lower valuation.
We don't have analyst forecasts, but you can see how recent trends are setting up the company for the future by checking out our free report on Shenzhen Neoway TechnologyLtd's earnings, revenue and cash flow.What Are Revenue Growth Metrics Telling Us About The Low P/S?
The only time you'd be truly comfortable seeing a P/S as low as Shenzhen Neoway TechnologyLtd's is when the company's growth is on track to lag the industry.
If we review the last year of revenue growth, the company posted a terrific increase of 51%. The latest three year period has also seen an excellent 121% overall rise in revenue, aided by its short-term performance. Therefore, it's fair to say the revenue growth recently has been superb for the company.
Comparing the recent medium-term revenue trends against the industry's one-year growth forecast of 49% shows it's noticeably less attractive.
With this information, we can see why Shenzhen Neoway TechnologyLtd is trading at a P/S lower than the industry. Apparently many shareholders weren't comfortable holding on to something they believe will continue to trail the wider industry.
The Bottom Line On Shenzhen Neoway TechnologyLtd's P/S
Despite Shenzhen Neoway TechnologyLtd's share price climbing recently, its P/S still lags most other companies. Generally, our preference is to limit the use of the price-to-sales ratio to establishing what the market thinks about the overall health of a company.
Our examination of Shenzhen Neoway TechnologyLtd confirms that the company's revenue trends over the past three-year years are a key factor in its low price-to-sales ratio, as we suspected, given they fall short of current industry expectations. Right now shareholders are accepting the low P/S as they concede future revenue probably won't provide any pleasant surprises. Unless the recent medium-term conditions improve, they will continue to form a barrier for the share price around these levels.
Plus, you should also learn about this 1 warning sign we've spotted with Shenzhen Neoway TechnologyLtd.
Of course, profitable companies with a history of great earnings growth are generally safer bets. So you may wish to see this free collection of other companies that have reasonable P/E ratios and have grown earnings strongly.
New: Manage All Your Stock Portfolios in One Place
We've created the ultimate portfolio companion for stock investors, and it's free.
• Connect an unlimited number of Portfolios and see your total in one currency
• Be alerted to new Warning Signs or Risks via email or mobile
• Track the Fair Value of your stocks
Have feedback on this article? Concerned about the content? Get in touch with us directly. Alternatively, email editorial-team (at) simplywallst.com.
This article by Simply Wall St is general in nature. We provide commentary based on historical data and analyst forecasts only using an unbiased methodology and our articles are not intended to be financial advice. It does not constitute a recommendation to buy or sell any stock, and does not take account of your objectives, or your financial situation. We aim to bring you long-term focused analysis driven by fundamental data. Note that our analysis may not factor in the latest price-sensitive company announcements or qualitative material. Simply Wall St has no position in any stocks mentioned.
About SHSE:688159
Shenzhen Neoway TechnologyLtd
Engages in the research and development, production, and sale of IoT wireless communication modules, IoT wireless communication terminals, IoT wireless communication solutions and cloud products in China.
Adequate balance sheet with low risk.
Market Insights

Advertisement
Community Narratives
MicroVision will explode future revenue by 380.37% with a vision towards success
Fair Value US$60|98.4% undervalued
TH
Community Contributor
The Indispensable Artery for a New North American Economy
Fair Value CA$132.87|1.6% undervalued
TI
Community Contributor
Recently Updated Narratives
BE


Bejgal on MINISO Group Holding ·
MINISO's fair value is projected at 26.69 with an anticipated PE ratio shift of 20x
Fair Value:US$26.6928.0% undervalued
44 followersusers have followed this narrative
3 commentsusers have commented on this narrative
0 likesusers have liked this narrative
TI


TickerTickle on Oracle ·
The Quiet Giant That Became AI’s Power Grid
Fair Value:US$389.8149.5% undervalued
7 followersusers have followed this narrative
1 commentusers have commented on this narrative
0 likesusers have liked this narrative
AU

AuCA on Nova Ljubljanska Banka d.d ·
Nova Ljubljanska Banka d.d will expect a 11.2% revenue boost driving future growth
Fair Value:€20916.5% undervalued
23 followersusers have followed this narrative
3 commentsusers have commented on this narrative
0 likesusers have liked this narrative
Popular Narratives
OS


oscargarcia on Alphabet ·
The company that turned a verb into a global necessity and basically runs the modern internet, digital ads, smartphones, maps, and AI.
Fair Value:US$3404.9% undervalued
136 followersusers have followed this narrative
6 commentsusers have commented on this narrative
18 likesusers have liked this narrative
TH

TheWallstreetKing on MicroVision ·
MicroVision will explode future revenue by 380.37% with a vision towards success
Fair Value:US$6098.4% undervalued
87 followersusers have followed this narrative
11 commentsusers have commented on this narrative
18 likesusers have liked this narrative
AN


AnalystConsensusTarget on NVIDIA ·
NVDA: Expanding AI Demand Will Drive Major Data Center Investments Through 2026
Fair Value:US$232.7923.6% undervalued
925 followersusers have followed this narrative
6 commentsusers have commented on this narrative
22 likesusers have liked this narrative