
Advertisement
- China
- /
- Communications
- /
- SHSE:603042
Investors Don't See Light At End Of Nanjing Huamai Technology Co., Ltd.'s (SHSE:603042) Tunnel And Push Stock Down 36%
The Nanjing Huamai Technology Co., Ltd. (SHSE:603042) share price has fared very poorly over the last month, falling by a substantial 36%. The drop over the last 30 days has capped off a tough year for shareholders, with the share price down 25% in that time.
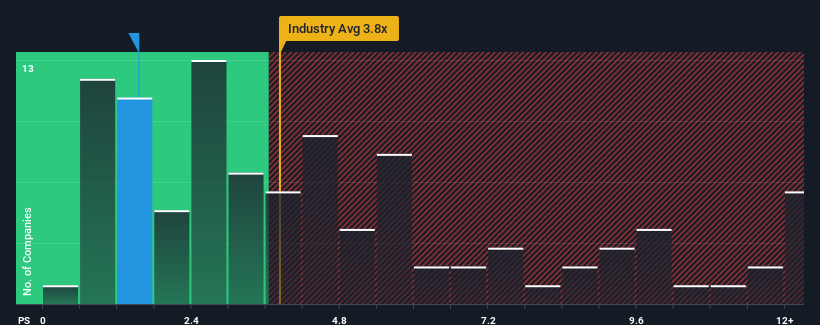
Following the heavy fall in price, Nanjing Huamai Technology may look like a strong buying opportunity at present with its price-to-sales (or "P/S") ratio of 1.5x, considering almost half of all companies in the Communications industry in China have P/S ratios greater than 3.8x and even P/S higher than 7x aren't out of the ordinary. Nonetheless, we'd need to dig a little deeper to determine if there is a rational basis for the highly reduced P/S.
View our latest analysis for Nanjing Huamai Technology
How Nanjing Huamai Technology Has Been Performing
For example, consider that Nanjing Huamai Technology's financial performance has been poor lately as its revenue has been in decline. One possibility is that the P/S is low because investors think the company won't do enough to avoid underperforming the broader industry in the near future. However, if this doesn't eventuate then existing shareholders may be feeling optimistic about the future direction of the share price.
We don't have analyst forecasts, but you can see how recent trends are setting up the company for the future by checking out our free report on Nanjing Huamai Technology's earnings, revenue and cash flow.Do Revenue Forecasts Match The Low P/S Ratio?
In order to justify its P/S ratio, Nanjing Huamai Technology would need to produce anemic growth that's substantially trailing the industry.
Taking a look back first, the company's revenue growth last year wasn't something to get excited about as it posted a disappointing decline of 14%. As a result, revenue from three years ago have also fallen 19% overall. Accordingly, shareholders would have felt downbeat about the medium-term rates of revenue growth.
Comparing that to the industry, which is predicted to deliver 50% growth in the next 12 months, the company's downward momentum based on recent medium-term revenue results is a sobering picture.
With this in mind, we understand why Nanjing Huamai Technology's P/S is lower than most of its industry peers. Nonetheless, there's no guarantee the P/S has reached a floor yet with revenue going in reverse. There's potential for the P/S to fall to even lower levels if the company doesn't improve its top-line growth.
What We Can Learn From Nanjing Huamai Technology's P/S?
Shares in Nanjing Huamai Technology have plummeted and its P/S has followed suit. Generally, our preference is to limit the use of the price-to-sales ratio to establishing what the market thinks about the overall health of a company.
As we suspected, our examination of Nanjing Huamai Technology revealed its shrinking revenue over the medium-term is contributing to its low P/S, given the industry is set to grow. Right now shareholders are accepting the low P/S as they concede future revenue probably won't provide any pleasant surprises either. If recent medium-term revenue trends continue, it's hard to see the share price moving strongly in either direction in the near future under these circumstances.
There are also other vital risk factors to consider and we've discovered 2 warning signs for Nanjing Huamai Technology (1 can't be ignored!) that you should be aware of before investing here.
If strong companies turning a profit tickle your fancy, then you'll want to check out this free list of interesting companies that trade on a low P/E (but have proven they can grow earnings).
Valuation is complex, but we're here to simplify it.
Discover if Nanjing Huamai Technology might be undervalued or overvalued with our detailed analysis, featuring fair value estimates, potential risks, dividends, insider trades, and its financial condition.
Access Free AnalysisHave feedback on this article? Concerned about the content? Get in touch with us directly. Alternatively, email editorial-team (at) simplywallst.com.
This article by Simply Wall St is general in nature. We provide commentary based on historical data and analyst forecasts only using an unbiased methodology and our articles are not intended to be financial advice. It does not constitute a recommendation to buy or sell any stock, and does not take account of your objectives, or your financial situation. We aim to bring you long-term focused analysis driven by fundamental data. Note that our analysis may not factor in the latest price-sensitive company announcements or qualitative material. Simply Wall St has no position in any stocks mentioned.
About SHSE:603042
Nanjing Huamai Technology
Engages in the research and development, design, manufacture, and sale of communication network equipment in China.
Flawless balance sheet and slightly overvalued.
Market Insights

Advertisement
Community Narratives
MicroVision will explode future revenue by 380.37% with a vision towards success
Fair Value US$60.00|98.4% undervalued
TH
Community Contributor
The Indispensable Artery for a New North American Economy
Fair Value CA$132.87|1.3% undervalued
TI
Community Contributor