
Advertisement
Nanjing TDH Technology Co.,Ltd. (SZSE:301378) Stock Rockets 29% As Investors Are Less Pessimistic Than Expected
Nanjing TDH Technology Co.,Ltd. (SZSE:301378) shares have had a really impressive month, gaining 29% after a shaky period beforehand. The last 30 days bring the annual gain to a very sharp 41%.
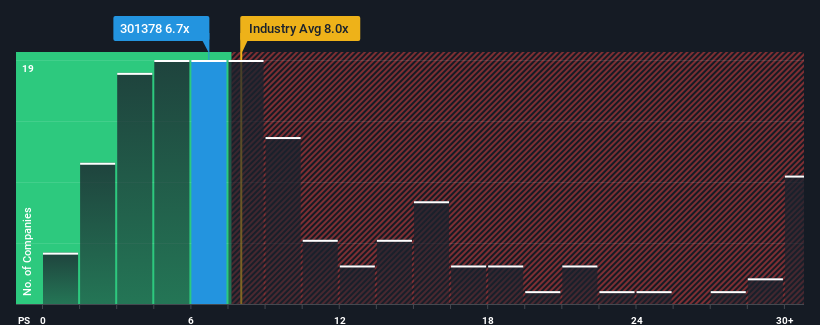
In spite of the firm bounce in price, you could still be forgiven for feeling indifferent about Nanjing TDH TechnologyLtd's P/S ratio of 6.7x, since the median price-to-sales (or "P/S") ratio for the Software industry in China is also close to 8x. Although, it's not wise to simply ignore the P/S without explanation as investors may be disregarding a distinct opportunity or a costly mistake.
See our latest analysis for Nanjing TDH TechnologyLtd
What Does Nanjing TDH TechnologyLtd's Recent Performance Look Like?
The recent revenue growth at Nanjing TDH TechnologyLtd would have to be considered satisfactory if not spectacular. Perhaps the expectation moving forward is that the revenue growth will track in line with the wider industry for the near term, which has kept the P/S subdued. If not, then at least existing shareholders probably aren't too pessimistic about the future direction of the share price.
Want the full picture on earnings, revenue and cash flow for the company? Then our free report on Nanjing TDH TechnologyLtd will help you shine a light on its historical performance.How Is Nanjing TDH TechnologyLtd's Revenue Growth Trending?
In order to justify its P/S ratio, Nanjing TDH TechnologyLtd would need to produce growth that's similar to the industry.
Taking a look back first, we see that the company managed to grow revenues by a handy 6.3% last year. The latest three year period has also seen a 15% overall rise in revenue, aided somewhat by its short-term performance. Therefore, it's fair to say the revenue growth recently has been respectable for the company.
This is in contrast to the rest of the industry, which is expected to grow by 27% over the next year, materially higher than the company's recent medium-term annualised growth rates.
In light of this, it's curious that Nanjing TDH TechnologyLtd's P/S sits in line with the majority of other companies. Apparently many investors in the company are less bearish than recent times would indicate and aren't willing to let go of their stock right now. They may be setting themselves up for future disappointment if the P/S falls to levels more in line with recent growth rates.
What Does Nanjing TDH TechnologyLtd's P/S Mean For Investors?
Its shares have lifted substantially and now Nanjing TDH TechnologyLtd's P/S is back within range of the industry median. It's argued the price-to-sales ratio is an inferior measure of value within certain industries, but it can be a powerful business sentiment indicator.
Our examination of Nanjing TDH TechnologyLtd revealed its poor three-year revenue trends aren't resulting in a lower P/S as per our expectations, given they look worse than current industry outlook. When we see weak revenue with slower than industry growth, we suspect the share price is at risk of declining, bringing the P/S back in line with expectations. Unless the recent medium-term conditions improve, it's hard to accept the current share price as fair value.
You need to take note of risks, for example - Nanjing TDH TechnologyLtd has 5 warning signs (and 3 which are potentially serious) we think you should know about.
If companies with solid past earnings growth is up your alley, you may wish to see this free collection of other companies with strong earnings growth and low P/E ratios.
Valuation is complex, but we're here to simplify it.
Discover if Nanjing TDH TechnologyLtd might be undervalued or overvalued with our detailed analysis, featuring fair value estimates, potential risks, dividends, insider trades, and its financial condition.
Access Free AnalysisHave feedback on this article? Concerned about the content? Get in touch with us directly. Alternatively, email editorial-team (at) simplywallst.com.
This article by Simply Wall St is general in nature. We provide commentary based on historical data and analyst forecasts only using an unbiased methodology and our articles are not intended to be financial advice. It does not constitute a recommendation to buy or sell any stock, and does not take account of your objectives, or your financial situation. We aim to bring you long-term focused analysis driven by fundamental data. Note that our analysis may not factor in the latest price-sensitive company announcements or qualitative material. Simply Wall St has no position in any stocks mentioned.
About SZSE:301378
Nanjing TDH TechnologyLtd
Engages in the research and development of judicial information systems and information technology services in China.
Mediocre balance sheet and slightly overvalued.
Market Insights

Advertisement
Community Narratives
MicroVision will explode future revenue by 380.37% with a vision towards success
Fair Value US$60.00|98.4% undervalued
TH
Community Contributor
The Indispensable Artery for a New North American Economy
Fair Value CA$132.87|1.3% undervalued
TI
Community Contributor