
Advertisement
Are Investors Undervaluing Sangfor Technologies Inc. (SZSE:300454) By 49%?
Key Insights
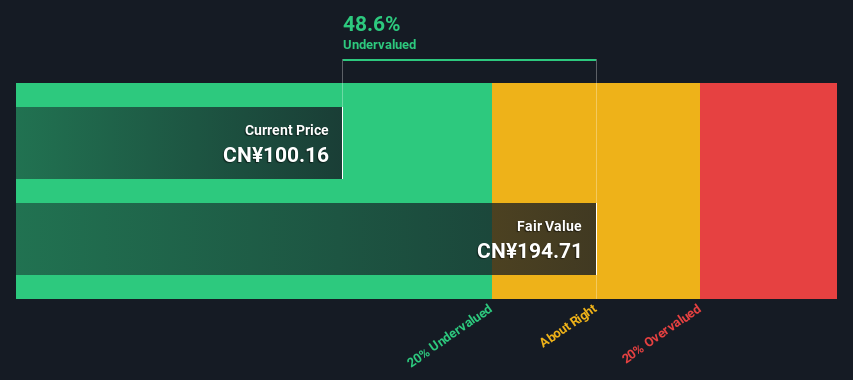
- Sangfor Technologies' estimated fair value is CN¥195 based on 2 Stage Free Cash Flow to Equity
- Sangfor Technologies' CN¥100 share price signals that it might be 49% undervalued
- Analyst price target for 300454 is CN¥89.81 which is 54% below our fair value estimate
How far off is Sangfor Technologies Inc. (SZSE:300454) from its intrinsic value? Using the most recent financial data, we'll take a look at whether the stock is fairly priced by taking the forecast future cash flows of the company and discounting them back to today's value. Our analysis will employ the Discounted Cash Flow (DCF) model. Believe it or not, it's not too difficult to follow, as you'll see from our example!
We generally believe that a company's value is the present value of all of the cash it will generate in the future. However, a DCF is just one valuation metric among many, and it is not without flaws. Anyone interested in learning a bit more about intrinsic value should have a read of the Simply Wall St analysis model.
The Method
We're using the 2-stage growth model, which simply means we take in account two stages of company's growth. In the initial period the company may have a higher growth rate and the second stage is usually assumed to have a stable growth rate. To start off with, we need to estimate the next ten years of cash flows. Where possible we use analyst estimates, but when these aren't available we extrapolate the previous free cash flow (FCF) from the last estimate or reported value. We assume companies with shrinking free cash flow will slow their rate of shrinkage, and that companies with growing free cash flow will see their growth rate slow, over this period. We do this to reflect that growth tends to slow more in the early years than it does in later years.
A DCF is all about the idea that a dollar in the future is less valuable than a dollar today, so we need to discount the sum of these future cash flows to arrive at a present value estimate:
10-year free cash flow (FCF) forecast
| 2025 | 2026 | 2027 | 2028 | 2029 | 2030 | 2031 | 2032 | 2033 | 2034 | |
| Levered FCF (CN¥, Millions) | CN¥1.20b | CN¥608.0m | CN¥2.28b | CN¥1.89b | CN¥3.46b | CN¥4.44b | CN¥5.36b | CN¥6.19b | CN¥6.91b | CN¥7.52b |
| Growth Rate Estimate Source | Analyst x1 | Analyst x2 | Analyst x1 | Analyst x1 | Analyst x1 | Est @ 28.52% | Est @ 20.79% | Est @ 15.37% | Est @ 11.58% | Est @ 8.93% |
| Present Value (CN¥, Millions) Discounted @ 8.5% | CN¥1.1k | CN¥516 | CN¥1.8k | CN¥1.4k | CN¥2.3k | CN¥2.7k | CN¥3.0k | CN¥3.2k | CN¥3.3k | CN¥3.3k |
("Est" = FCF growth rate estimated by Simply Wall St)
Present Value of 10-year Cash Flow (PVCF) = CN¥23b
We now need to calculate the Terminal Value, which accounts for all the future cash flows after this ten year period. For a number of reasons a very conservative growth rate is used that cannot exceed that of a country's GDP growth. In this case we have used the 5-year average of the 10-year government bond yield (2.7%) to estimate future growth. In the same way as with the 10-year 'growth' period, we discount future cash flows to today's value, using a cost of equity of 8.5%.
Terminal Value (TV)= FCF2034 × (1 + g) ÷ (r – g) = CN¥7.5b× (1 + 2.7%) ÷ (8.5%– 2.7%) = CN¥133b
Present Value of Terminal Value (PVTV)= TV / (1 + r)10= CN¥133b÷ ( 1 + 8.5%)10= CN¥59b
The total value, or equity value, is then the sum of the present value of the future cash flows, which in this case is CN¥81b. The last step is to then divide the equity value by the number of shares outstanding. Relative to the current share price of CN¥100, the company appears quite good value at a 49% discount to where the stock price trades currently. Valuations are imprecise instruments though, rather like a telescope - move a few degrees and end up in a different galaxy. Do keep this in mind.
The Assumptions
We would point out that the most important inputs to a discounted cash flow are the discount rate and of course the actual cash flows. Part of investing is coming up with your own evaluation of a company's future performance, so try the calculation yourself and check your own assumptions. The DCF also does not consider the possible cyclicality of an industry, or a company's future capital requirements, so it does not give a full picture of a company's potential performance. Given that we are looking at Sangfor Technologies as potential shareholders, the cost of equity is used as the discount rate, rather than the cost of capital (or weighted average cost of capital, WACC) which accounts for debt. In this calculation we've used 8.5%, which is based on a levered beta of 1.102. Beta is a measure of a stock's volatility, compared to the market as a whole. We get our beta from the industry average beta of globally comparable companies, with an imposed limit between 0.8 and 2.0, which is a reasonable range for a stable business.
View our latest analysis for Sangfor Technologies
SWOT Analysis for Sangfor Technologies
Strength
- Net debt to equity ratio below 40%.
Weakness
- Earnings declined over the past year.
- Dividend is low compared to the top 25% of dividend payers in the Software market.
Opportunity
- Annual earnings are forecast to grow faster than the Chinese market.
- Good value based on P/S ratio and estimated fair value.
Threat
- Debt is not well covered by operating cash flow.
- Revenue is forecast to grow slower than 20% per year.
Next Steps:
Whilst important, the DCF calculation ideally won't be the sole piece of analysis you scrutinize for a company. It's not possible to obtain a foolproof valuation with a DCF model. Instead the best use for a DCF model is to test certain assumptions and theories to see if they would lead to the company being undervalued or overvalued. For instance, if the terminal value growth rate is adjusted slightly, it can dramatically alter the overall result. Can we work out why the company is trading at a discount to intrinsic value? For Sangfor Technologies, there are three fundamental items you should further research:
- Risks: We feel that you should assess the 3 warning signs for Sangfor Technologies (1 is potentially serious!) we've flagged before making an investment in the company.
- Future Earnings: How does 300454's growth rate compare to its peers and the wider market? Dig deeper into the analyst consensus number for the upcoming years by interacting with our free analyst growth expectation chart.
- Other High Quality Alternatives: Do you like a good all-rounder? Explore our interactive list of high quality stocks to get an idea of what else is out there you may be missing!
PS. The Simply Wall St app conducts a discounted cash flow valuation for every stock on the SZSE every day. If you want to find the calculation for other stocks just search here.
New: Manage All Your Stock Portfolios in One Place
We've created the ultimate portfolio companion for stock investors, and it's free.
• Connect an unlimited number of Portfolios and see your total in one currency
• Be alerted to new Warning Signs or Risks via email or mobile
• Track the Fair Value of your stocks
Have feedback on this article? Concerned about the content? Get in touch with us directly. Alternatively, email editorial-team (at) simplywallst.com.
This article by Simply Wall St is general in nature. We provide commentary based on historical data and analyst forecasts only using an unbiased methodology and our articles are not intended to be financial advice. It does not constitute a recommendation to buy or sell any stock, and does not take account of your objectives, or your financial situation. We aim to bring you long-term focused analysis driven by fundamental data. Note that our analysis may not factor in the latest price-sensitive company announcements or qualitative material. Simply Wall St has no position in any stocks mentioned.
About SZSE:300454
Sangfor Technologies
Provides IT infrastructure, cloud computing, and network security solutions in China and internationally.
Excellent balance sheet with proven track record.
Similar Companies
Market Insights

Advertisement
Community Narratives
MicroVision will explode future revenue by 380.37% with a vision towards success
Fair Value US$60.00|98.5% undervalued
TH
Community Contributor
The Indispensable Artery for a New North American Economy
Fair Value CA$132.87|2.3% undervalued
TI
Community Contributor