
Advertisement
Shenzhen Ysstech Info-Tech Co.,Ltd's (SZSE:300377) Shares Climb 39% But Its Business Is Yet to Catch Up
Those holding Shenzhen Ysstech Info-Tech Co.,Ltd (SZSE:300377) shares would be relieved that the share price has rebounded 39% in the last thirty days, but it needs to keep going to repair the recent damage it has caused to investor portfolios. Not all shareholders will be feeling jubilant, since the share price is still down a very disappointing 30% in the last twelve months.
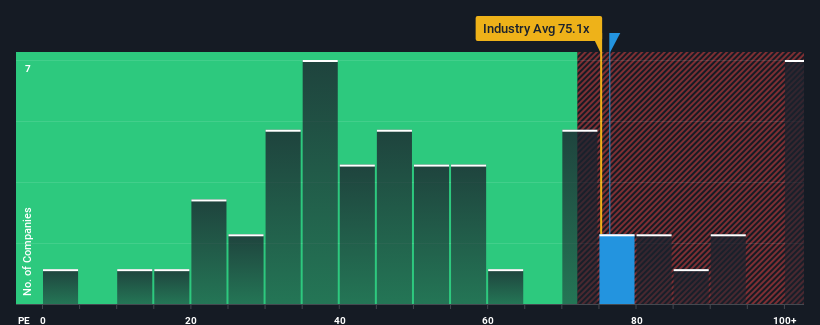
Following the firm bounce in price, Shenzhen Ysstech Info-TechLtd's price-to-earnings (or "P/E") ratio of 76.3x might make it look like a strong sell right now compared to the market in China, where around half of the companies have P/E ratios below 29x and even P/E's below 18x are quite common. Nonetheless, we'd need to dig a little deeper to determine if there is a rational basis for the highly elevated P/E.
Earnings have risen at a steady rate over the last year for Shenzhen Ysstech Info-TechLtd, which is generally not a bad outcome. One possibility is that the P/E is high because investors think this good earnings growth will be enough to outperform the broader market in the near future. If not, then existing shareholders may be a little nervous about the viability of the share price.
View our latest analysis for Shenzhen Ysstech Info-TechLtd
What Are Growth Metrics Telling Us About The High P/E?
In order to justify its P/E ratio, Shenzhen Ysstech Info-TechLtd would need to produce outstanding growth well in excess of the market.
Retrospectively, the last year delivered a decent 5.3% gain to the company's bottom line. Still, lamentably EPS has fallen 55% in aggregate from three years ago, which is disappointing. Therefore, it's fair to say the earnings growth recently has been undesirable for the company.
Comparing that to the market, which is predicted to deliver 41% growth in the next 12 months, the company's downward momentum based on recent medium-term earnings results is a sobering picture.
In light of this, it's alarming that Shenzhen Ysstech Info-TechLtd's P/E sits above the majority of other companies. Apparently many investors in the company are way more bullish than recent times would indicate and aren't willing to let go of their stock at any price. Only the boldest would assume these prices are sustainable as a continuation of recent earnings trends is likely to weigh heavily on the share price eventually.
The Bottom Line On Shenzhen Ysstech Info-TechLtd's P/E
Shares in Shenzhen Ysstech Info-TechLtd have built up some good momentum lately, which has really inflated its P/E. We'd say the price-to-earnings ratio's power isn't primarily as a valuation instrument but rather to gauge current investor sentiment and future expectations.
We've established that Shenzhen Ysstech Info-TechLtd currently trades on a much higher than expected P/E since its recent earnings have been in decline over the medium-term. When we see earnings heading backwards and underperforming the market forecasts, we suspect the share price is at risk of declining, sending the high P/E lower. Unless the recent medium-term conditions improve markedly, it's very challenging to accept these prices as being reasonable.
You should always think about risks. Case in point, we've spotted 4 warning signs for Shenzhen Ysstech Info-TechLtd you should be aware of, and 2 of them make us uncomfortable.
If P/E ratios interest you, you may wish to see this free collection of other companies with strong earnings growth and low P/E ratios.
New: Manage All Your Stock Portfolios in One Place
We've created the ultimate portfolio companion for stock investors, and it's free.
• Connect an unlimited number of Portfolios and see your total in one currency
• Be alerted to new Warning Signs or Risks via email or mobile
• Track the Fair Value of your stocks
Have feedback on this article? Concerned about the content? Get in touch with us directly. Alternatively, email editorial-team (at) simplywallst.com.
This article by Simply Wall St is general in nature. We provide commentary based on historical data and analyst forecasts only using an unbiased methodology and our articles are not intended to be financial advice. It does not constitute a recommendation to buy or sell any stock, and does not take account of your objectives, or your financial situation. We aim to bring you long-term focused analysis driven by fundamental data. Note that our analysis may not factor in the latest price-sensitive company announcements or qualitative material. Simply Wall St has no position in any stocks mentioned.
About SZSE:300377
Shenzhen Ysstech Info-TechLtd
Provides application software and services for financial institution asset management and custody business systems in the China.
Flawless balance sheet with minimal risk.
Market Insights

Advertisement
Community Narratives
MicroVision will explode future revenue by 380.37% with a vision towards success
Fair Value US$60.00|98.5% undervalued
TH
Community Contributor
The Indispensable Artery for a New North American Economy
Fair Value CA$132.87|2.3% undervalued
TI
Community Contributor