
Advertisement
- China
- /
- General Merchandise and Department Stores
- /
- SZSE:300209
Youkeshu Technology Co.,Ltd (SZSE:300209) Not Doing Enough For Some Investors As Its Shares Slump 25%
Unfortunately for some shareholders, the Youkeshu Technology Co.,Ltd (SZSE:300209) share price has dived 25% in the last thirty days, prolonging recent pain. Instead of being rewarded, shareholders who have already held through the last twelve months are now sitting on a 24% share price drop.
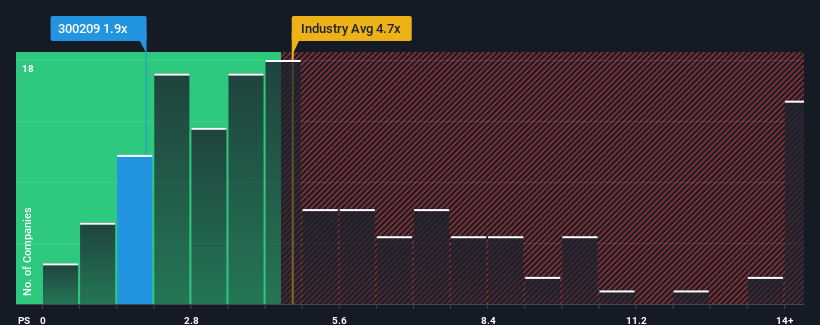
After such a large drop in price, Youkeshu TechnologyLtd may look like a strong buying opportunity at present with its price-to-sales (or "P/S") ratio of 1.9x, considering almost half of all companies in the Software industry in China have P/S ratios greater than 4.7x and even P/S higher than 8x aren't out of the ordinary. Although, it's not wise to just take the P/S at face value as there may be an explanation why it's so limited.
Check out our latest analysis for Youkeshu TechnologyLtd
How Youkeshu TechnologyLtd Has Been Performing
For instance, Youkeshu TechnologyLtd's receding revenue in recent times would have to be some food for thought. Perhaps the market believes the recent revenue performance isn't good enough to keep up the industry, causing the P/S ratio to suffer. However, if this doesn't eventuate then existing shareholders may be feeling optimistic about the future direction of the share price.
We don't have analyst forecasts, but you can see how recent trends are setting up the company for the future by checking out our free report on Youkeshu TechnologyLtd's earnings, revenue and cash flow.Do Revenue Forecasts Match The Low P/S Ratio?
In order to justify its P/S ratio, Youkeshu TechnologyLtd would need to produce anemic growth that's substantially trailing the industry.
Retrospectively, the last year delivered a frustrating 40% decrease to the company's top line. This means it has also seen a slide in revenue over the longer-term as revenue is down 91% in total over the last three years. Accordingly, shareholders would have felt downbeat about the medium-term rates of revenue growth.
In contrast to the company, the rest of the industry is expected to grow by 30% over the next year, which really puts the company's recent medium-term revenue decline into perspective.
In light of this, it's understandable that Youkeshu TechnologyLtd's P/S would sit below the majority of other companies. Nonetheless, there's no guarantee the P/S has reached a floor yet with revenue going in reverse. There's potential for the P/S to fall to even lower levels if the company doesn't improve its top-line growth.
What We Can Learn From Youkeshu TechnologyLtd's P/S?
Youkeshu TechnologyLtd's P/S looks about as weak as its stock price lately. While the price-to-sales ratio shouldn't be the defining factor in whether you buy a stock or not, it's quite a capable barometer of revenue expectations.
It's no surprise that Youkeshu TechnologyLtd maintains its low P/S off the back of its sliding revenue over the medium-term. At this stage investors feel the potential for an improvement in revenue isn't great enough to justify a higher P/S ratio. If recent medium-term revenue trends continue, it's hard to see the share price moving strongly in either direction in the near future under these circumstances.
Before you settle on your opinion, we've discovered 4 warning signs for Youkeshu TechnologyLtd that you should be aware of.
It's important to make sure you look for a great company, not just the first idea you come across. So if growing profitability aligns with your idea of a great company, take a peek at this free list of interesting companies with strong recent earnings growth (and a low P/E).
New: Manage All Your Stock Portfolios in One Place
We've created the ultimate portfolio companion for stock investors, and it's free.
• Connect an unlimited number of Portfolios and see your total in one currency
• Be alerted to new Warning Signs or Risks via email or mobile
• Track the Fair Value of your stocks
Have feedback on this article? Concerned about the content? Get in touch with us directly. Alternatively, email editorial-team (at) simplywallst.com.
This article by Simply Wall St is general in nature. We provide commentary based on historical data and analyst forecasts only using an unbiased methodology and our articles are not intended to be financial advice. It does not constitute a recommendation to buy or sell any stock, and does not take account of your objectives, or your financial situation. We aim to bring you long-term focused analysis driven by fundamental data. Note that our analysis may not factor in the latest price-sensitive company announcements or qualitative material. Simply Wall St has no position in any stocks mentioned.
Have feedback on this article? Concerned about the content? Get in touch with us directly. Alternatively, email editorial-team@simplywallst.com
About SZSE:300209
Youkeshu TechnologyLtd
Engages in cross-border e-commerce business in China.
Flawless balance sheet with low risk.
Market Insights

Advertisement
Community Narratives
MicroVision will explode future revenue by 380.37% with a vision towards success
Fair Value US$60.00|98.5% undervalued
TH
Community Contributor
The Indispensable Artery for a New North American Economy
Fair Value CA$132.87|2.3% undervalued
TI
Community Contributor