
Advertisement
Benign Growth For YLZ Information Technology Co.,Ltd (SZSE:300096) Underpins Stock's 27% Plummet
To the annoyance of some shareholders, YLZ Information Technology Co.,Ltd (SZSE:300096) shares are down a considerable 27% in the last month, which continues a horrid run for the company. For any long-term shareholders, the last month ends a year to forget by locking in a 67% share price decline.
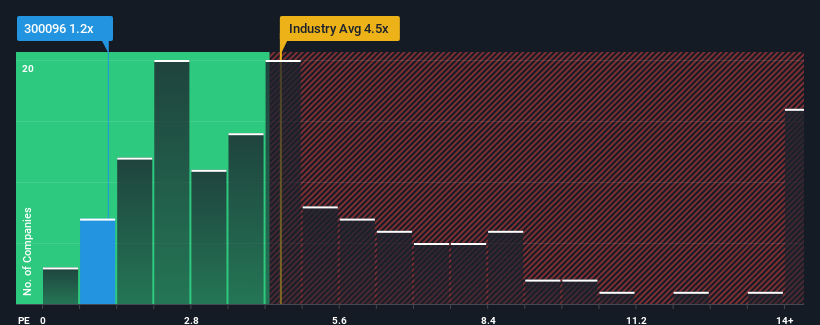
Since its price has dipped substantially, YLZ Information TechnologyLtd's price-to-sales (or "P/S") ratio of 1.2x might make it look like a strong buy right now compared to the wider Software industry in China, where around half of the companies have P/S ratios above 4.5x and even P/S above 8x are quite common. Although, it's not wise to just take the P/S at face value as there may be an explanation why it's so limited.
View our latest analysis for YLZ Information TechnologyLtd
How YLZ Information TechnologyLtd Has Been Performing
The revenue growth achieved at YLZ Information TechnologyLtd over the last year would be more than acceptable for most companies. One possibility is that the P/S is low because investors think this respectable revenue growth might actually underperform the broader industry in the near future. Those who are bullish on YLZ Information TechnologyLtd will be hoping that this isn't the case, so that they can pick up the stock at a lower valuation.
We don't have analyst forecasts, but you can see how recent trends are setting up the company for the future by checking out our free report on YLZ Information TechnologyLtd's earnings, revenue and cash flow.How Is YLZ Information TechnologyLtd's Revenue Growth Trending?
The only time you'd be truly comfortable seeing a P/S as depressed as YLZ Information TechnologyLtd's is when the company's growth is on track to lag the industry decidedly.
Retrospectively, the last year delivered an exceptional 18% gain to the company's top line. Still, revenue has fallen 31% in total from three years ago, which is quite disappointing. So unfortunately, we have to acknowledge that the company has not done a great job of growing revenues over that time.
In contrast to the company, the rest of the industry is expected to grow by 29% over the next year, which really puts the company's recent medium-term revenue decline into perspective.
With this in mind, we understand why YLZ Information TechnologyLtd's P/S is lower than most of its industry peers. Nonetheless, there's no guarantee the P/S has reached a floor yet with revenue going in reverse. Even just maintaining these prices could be difficult to achieve as recent revenue trends are already weighing down the shares.
What We Can Learn From YLZ Information TechnologyLtd's P/S?
YLZ Information TechnologyLtd's P/S looks about as weak as its stock price lately. Typically, we'd caution against reading too much into price-to-sales ratios when settling on investment decisions, though it can reveal plenty about what other market participants think about the company.
As we suspected, our examination of YLZ Information TechnologyLtd revealed its shrinking revenue over the medium-term is contributing to its low P/S, given the industry is set to grow. At this stage investors feel the potential for an improvement in revenue isn't great enough to justify a higher P/S ratio. Unless the recent medium-term conditions improve, they will continue to form a barrier for the share price around these levels.
We don't want to rain on the parade too much, but we did also find 2 warning signs for YLZ Information TechnologyLtd that you need to be mindful of.
Of course, profitable companies with a history of great earnings growth are generally safer bets. So you may wish to see this free collection of other companies that have reasonable P/E ratios and have grown earnings strongly.
New: Manage All Your Stock Portfolios in One Place
We've created the ultimate portfolio companion for stock investors, and it's free.
• Connect an unlimited number of Portfolios and see your total in one currency
• Be alerted to new Warning Signs or Risks via email or mobile
• Track the Fair Value of your stocks
Have feedback on this article? Concerned about the content? Get in touch with us directly. Alternatively, email editorial-team (at) simplywallst.com.
This article by Simply Wall St is general in nature. We provide commentary based on historical data and analyst forecasts only using an unbiased methodology and our articles are not intended to be financial advice. It does not constitute a recommendation to buy or sell any stock, and does not take account of your objectives, or your financial situation. We aim to bring you long-term focused analysis driven by fundamental data. Note that our analysis may not factor in the latest price-sensitive company announcements or qualitative material. Simply Wall St has no position in any stocks mentioned.
Have feedback on this article? Concerned about the content? Get in touch with us directly. Alternatively, email editorial-team@simplywallst.com
About SZSE:300096
YLZ Information TechnologyLtd
Provides digital solutions for domestic people livelihood field in China.
Excellent balance sheet and slightly overvalued.
Market Insights

Advertisement
Community Narratives
MicroVision will explode future revenue by 380.37% with a vision towards success
Fair Value US$60.00|98.4% undervalued
TH
Community Contributor
The Indispensable Artery for a New North American Economy
Fair Value CA$132.87|1.3% undervalued
TI
Community Contributor