
Advertisement
Shenzhen Tianyuan DIC Information Technology Co., Ltd.'s (SZSE:300047) Shares Bounce 86% But Its Business Still Trails The Industry
Shenzhen Tianyuan DIC Information Technology Co., Ltd. (SZSE:300047) shares have continued their recent momentum with a 86% gain in the last month alone. Looking back a bit further, it's encouraging to see the stock is up 61% in the last year.
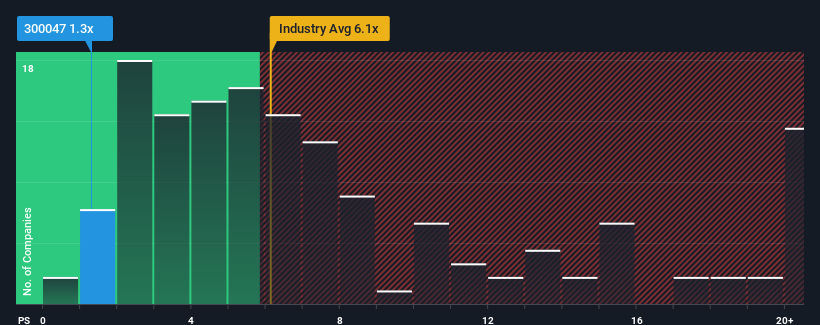
In spite of the firm bounce in price, Shenzhen Tianyuan DIC Information Technology may still be sending very bullish signals at the moment with its price-to-sales (or "P/S") ratio of 1.3x, since almost half of all companies in the Software industry in China have P/S ratios greater than 6.1x and even P/S higher than 11x are not unusual. Nonetheless, we'd need to dig a little deeper to determine if there is a rational basis for the highly reduced P/S.
See our latest analysis for Shenzhen Tianyuan DIC Information Technology
How Shenzhen Tianyuan DIC Information Technology Has Been Performing
Revenue has risen firmly for Shenzhen Tianyuan DIC Information Technology recently, which is pleasing to see. Perhaps the market is expecting this acceptable revenue performance to take a dive, which has kept the P/S suppressed. Those who are bullish on Shenzhen Tianyuan DIC Information Technology will be hoping that this isn't the case, so that they can pick up the stock at a lower valuation.
We don't have analyst forecasts, but you can see how recent trends are setting up the company for the future by checking out our free report on Shenzhen Tianyuan DIC Information Technology's earnings, revenue and cash flow.What Are Revenue Growth Metrics Telling Us About The Low P/S?
There's an inherent assumption that a company should far underperform the industry for P/S ratios like Shenzhen Tianyuan DIC Information Technology's to be considered reasonable.
If we review the last year of revenue growth, the company posted a terrific increase of 21%. The strong recent performance means it was also able to grow revenue by 31% in total over the last three years. So we can start by confirming that the company has done a great job of growing revenue over that time.
Comparing that to the industry, which is predicted to deliver 27% growth in the next 12 months, the company's momentum is weaker, based on recent medium-term annualised revenue results.
With this information, we can see why Shenzhen Tianyuan DIC Information Technology is trading at a P/S lower than the industry. It seems most investors are expecting to see the recent limited growth rates continue into the future and are only willing to pay a reduced amount for the stock.
What Does Shenzhen Tianyuan DIC Information Technology's P/S Mean For Investors?
Even after such a strong price move, Shenzhen Tianyuan DIC Information Technology's P/S still trails the rest of the industry. Generally, our preference is to limit the use of the price-to-sales ratio to establishing what the market thinks about the overall health of a company.
In line with expectations, Shenzhen Tianyuan DIC Information Technology maintains its low P/S on the weakness of its recent three-year growth being lower than the wider industry forecast. At this stage investors feel the potential for an improvement in revenue isn't great enough to justify a higher P/S ratio. If recent medium-term revenue trends continue, it's hard to see the share price experience a reversal of fortunes anytime soon.
It is also worth noting that we have found 4 warning signs for Shenzhen Tianyuan DIC Information Technology (3 can't be ignored!) that you need to take into consideration.
If you're unsure about the strength of Shenzhen Tianyuan DIC Information Technology's business, why not explore our interactive list of stocks with solid business fundamentals for some other companies you may have missed.
New: Manage All Your Stock Portfolios in One Place
We've created the ultimate portfolio companion for stock investors, and it's free.
• Connect an unlimited number of Portfolios and see your total in one currency
• Be alerted to new Warning Signs or Risks via email or mobile
• Track the Fair Value of your stocks
Have feedback on this article? Concerned about the content? Get in touch with us directly. Alternatively, email editorial-team (at) simplywallst.com.
This article by Simply Wall St is general in nature. We provide commentary based on historical data and analyst forecasts only using an unbiased methodology and our articles are not intended to be financial advice. It does not constitute a recommendation to buy or sell any stock, and does not take account of your objectives, or your financial situation. We aim to bring you long-term focused analysis driven by fundamental data. Note that our analysis may not factor in the latest price-sensitive company announcements or qualitative material. Simply Wall St has no position in any stocks mentioned.
About SZSE:300047
Shenzhen Tianyuan DIC Information Technology
Shenzhen Tianyuan DIC Information Technology Co., Ltd.
Good value with acceptable track record.
Similar Companies
Market Insights

Advertisement
Community Narratives
MicroVision will explode future revenue by 380.37% with a vision towards success
Fair Value US$60.00|98.4% undervalued
TH
Community Contributor
The Indispensable Artery for a New North American Economy
Fair Value CA$132.87|1.3% undervalued
TI
Community Contributor