
Advertisement
Beijing SuperMap Software Co., Ltd. (SZSE:300036) Could Be Riskier Than It Looks
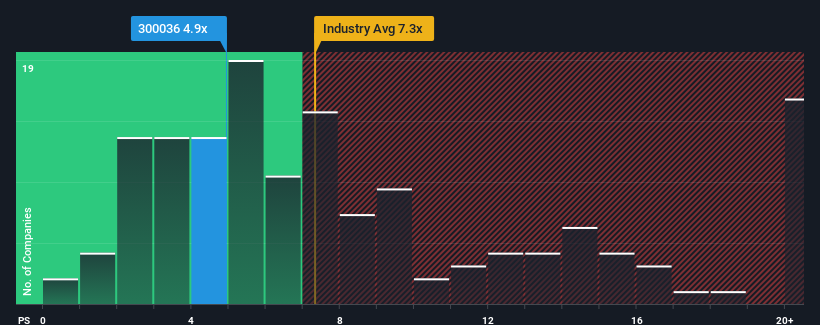
With a price-to-sales (or "P/S") ratio of 4.9x Beijing SuperMap Software Co., Ltd. (SZSE:300036) may be sending bullish signals at the moment, given that almost half of all the Software companies in China have P/S ratios greater than 7.3x and even P/S higher than 13x are not unusual. Although, it's not wise to just take the P/S at face value as there may be an explanation why it's limited.
See our latest analysis for Beijing SuperMap Software
How Has Beijing SuperMap Software Performed Recently?
Beijing SuperMap Software could be doing better as its revenue has been going backwards lately while most other companies have been seeing positive revenue growth. It seems that many are expecting the poor revenue performance to persist, which has repressed the P/S ratio. So while you could say the stock is cheap, investors will be looking for improvement before they see it as good value.
Want the full picture on analyst estimates for the company? Then our free report on Beijing SuperMap Software will help you uncover what's on the horizon.What Are Revenue Growth Metrics Telling Us About The Low P/S?
There's an inherent assumption that a company should underperform the industry for P/S ratios like Beijing SuperMap Software's to be considered reasonable.
Taking a look back first, the company's revenue growth last year wasn't something to get excited about as it posted a disappointing decline of 11%. This means it has also seen a slide in revenue over the longer-term as revenue is down 8.7% in total over the last three years. So unfortunately, we have to acknowledge that the company has not done a great job of growing revenue over that time.
Shifting to the future, estimates from the three analysts covering the company suggest revenue should grow by 33% over the next year. That's shaping up to be materially higher than the 26% growth forecast for the broader industry.
With this in consideration, we find it intriguing that Beijing SuperMap Software's P/S sits behind most of its industry peers. It looks like most investors are not convinced at all that the company can achieve future growth expectations.
What We Can Learn From Beijing SuperMap Software's P/S?
Using the price-to-sales ratio alone to determine if you should sell your stock isn't sensible, however it can be a practical guide to the company's future prospects.
Beijing SuperMap Software's analyst forecasts revealed that its superior revenue outlook isn't contributing to its P/S anywhere near as much as we would have predicted. There could be some major risk factors that are placing downward pressure on the P/S ratio. It appears the market could be anticipating revenue instability, because these conditions should normally provide a boost to the share price.
There are also other vital risk factors to consider before investing and we've discovered 1 warning sign for Beijing SuperMap Software that you should be aware of.
If you're unsure about the strength of Beijing SuperMap Software's business, why not explore our interactive list of stocks with solid business fundamentals for some other companies you may have missed.
Valuation is complex, but we're here to simplify it.
Discover if Beijing SuperMap Software might be undervalued or overvalued with our detailed analysis, featuring fair value estimates, potential risks, dividends, insider trades, and its financial condition.
Access Free AnalysisHave feedback on this article? Concerned about the content? Get in touch with us directly. Alternatively, email editorial-team (at) simplywallst.com.
This article by Simply Wall St is general in nature. We provide commentary based on historical data and analyst forecasts only using an unbiased methodology and our articles are not intended to be financial advice. It does not constitute a recommendation to buy or sell any stock, and does not take account of your objectives, or your financial situation. We aim to bring you long-term focused analysis driven by fundamental data. Note that our analysis may not factor in the latest price-sensitive company announcements or qualitative material. Simply Wall St has no position in any stocks mentioned.
About SZSE:300036
Beijing SuperMap Software
Provides geographic information system and spatial intelligence software products and services in China and internationally.
Adequate balance sheet with moderate growth potential.
Similar Companies
Market Insights

Advertisement
Community Narratives
MicroVision will explode future revenue by 380.37% with a vision towards success
Fair Value US$60.00|98.4% undervalued
TH
Community Contributor
The Indispensable Artery for a New North American Economy
Fair Value CA$132.87|1.3% undervalued
TI
Community Contributor