Ronglian Group (SZSE:002642) surges 14% this week, taking three-year gains to 40%

By buying an index fund, investors can approximate the average market return. But if you choose individual stocks with prowess, you can make superior returns. For example, Ronglian Group Ltd. (SZSE:002642) shareholders have seen the share price rise 40% over three years, well in excess of the market decline (25%, not including dividends).
On the back of a solid 7-day performance, let's check what role the company's fundamentals have played in driving long term shareholder returns.
View our latest analysis for Ronglian Group
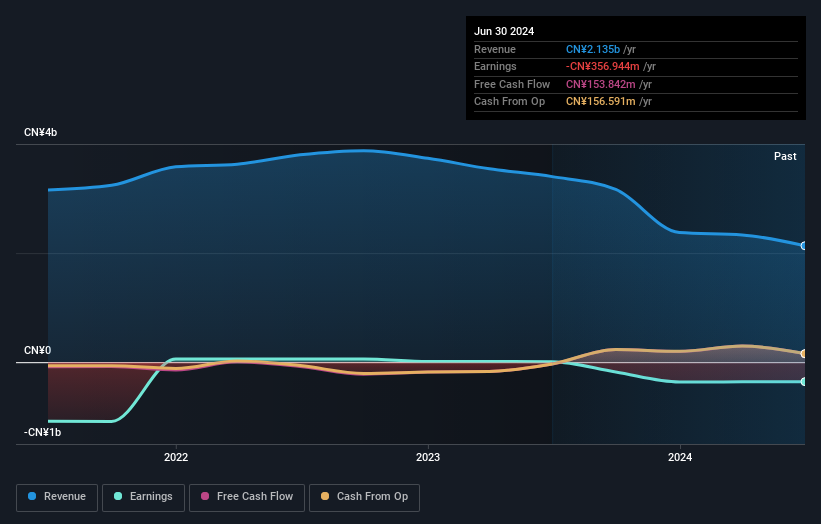
Given that Ronglian Group didn't make a profit in the last twelve months, we'll focus on revenue growth to form a quick view of its business development. Shareholders of unprofitable companies usually desire strong revenue growth. That's because fast revenue growth can be easily extrapolated to forecast profits, often of considerable size.
Ronglian Group actually saw its revenue drop by 12% per year over three years. Despite the lack of revenue growth, the stock has returned 12%, compound, over three years. Unless the company is going to make profits soon, we would be pretty cautious about it.
You can see how earnings and revenue have changed over time in the image below (click on the chart to see the exact values).

If you are thinking of buying or selling Ronglian Group stock, you should check out this FREE detailed report on its balance sheet.
A Different Perspective
We regret to report that Ronglian Group shareholders are down 37% for the year. Unfortunately, that's worse than the broader market decline of 6.0%. However, it could simply be that the share price has been impacted by broader market jitters. It might be worth keeping an eye on the fundamentals, in case there's a good opportunity. On the bright side, long term shareholders have made money, with a gain of 1.5% per year over half a decade. It could be that the recent sell-off is an opportunity, so it may be worth checking the fundamental data for signs of a long term growth trend. Shareholders might want to examine this detailed historical graph of past earnings, revenue and cash flow.
If you would prefer to check out another company -- one with potentially superior financials -- then do not miss this free list of companies that have proven they can grow earnings.
Please note, the market returns quoted in this article reflect the market weighted average returns of stocks that currently trade on Chinese exchanges.
New: AI Stock Screener & Alerts
Our new AI Stock Screener scans the market every day to uncover opportunities.
• Dividend Powerhouses (3%+ Yield)
• Undervalued Small Caps with Insider Buying
• High growth Tech and AI Companies
Or build your own from over 50 metrics.
Have feedback on this article? Concerned about the content? Get in touch with us directly. Alternatively, email editorial-team (at) simplywallst.com.
This article by Simply Wall St is general in nature. We provide commentary based on historical data and analyst forecasts only using an unbiased methodology and our articles are not intended to be financial advice. It does not constitute a recommendation to buy or sell any stock, and does not take account of your objectives, or your financial situation. We aim to bring you long-term focused analysis driven by fundamental data. Note that our analysis may not factor in the latest price-sensitive company announcements or qualitative material. Simply Wall St has no position in any stocks mentioned.
About SZSE:002642
Excellent balance sheet and slightly overvalued.

