
Advertisement
Qi An Xin Technology Group Inc.'s (SHSE:688561) Share Price Boosted 26% But Its Business Prospects Need A Lift Too
Qi An Xin Technology Group Inc. (SHSE:688561) shareholders are no doubt pleased to see that the share price has bounced 26% in the last month, although it is still struggling to make up recently lost ground. But the last month did very little to improve the 52% share price decline over the last year.
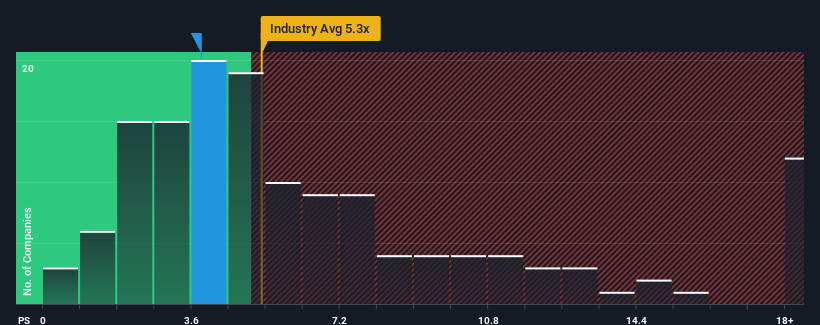
Although its price has surged higher, Qi An Xin Technology Group may still be sending bullish signals at the moment with its price-to-sales (or "P/S") ratio of 3.8x, since almost half of all companies in the Software industry in China have P/S ratios greater than 5.3x and even P/S higher than 9x are not unusual. Although, it's not wise to just take the P/S at face value as there may be an explanation why it's limited.
See our latest analysis for Qi An Xin Technology Group
What Does Qi An Xin Technology Group's P/S Mean For Shareholders?
Recent revenue growth for Qi An Xin Technology Group has been in line with the industry. It might be that many expect the mediocre revenue performance to degrade, which has repressed the P/S ratio. If you like the company, you'd be hoping this isn't the case so that you could pick up some stock while it's out of favour.
Want the full picture on analyst estimates for the company? Then our free report on Qi An Xin Technology Group will help you uncover what's on the horizon.Do Revenue Forecasts Match The Low P/S Ratio?
The only time you'd be truly comfortable seeing a P/S as low as Qi An Xin Technology Group's is when the company's growth is on track to lag the industry.
If we review the last year of revenue growth, the company posted a worthy increase of 3.6%. This was backed up an excellent period prior to see revenue up by 55% in total over the last three years. Therefore, it's fair to say the revenue growth recently has been superb for the company.
Shifting to the future, estimates from the ten analysts covering the company suggest revenue should grow by 20% per annum over the next three years. With the industry predicted to deliver 27% growth per year, the company is positioned for a weaker revenue result.
In light of this, it's understandable that Qi An Xin Technology Group's P/S sits below the majority of other companies. Apparently many shareholders weren't comfortable holding on while the company is potentially eyeing a less prosperous future.
What Does Qi An Xin Technology Group's P/S Mean For Investors?
Despite Qi An Xin Technology Group's share price climbing recently, its P/S still lags most other companies. Using the price-to-sales ratio alone to determine if you should sell your stock isn't sensible, however it can be a practical guide to the company's future prospects.
As we suspected, our examination of Qi An Xin Technology Group's analyst forecasts revealed that its inferior revenue outlook is contributing to its low P/S. At this stage investors feel the potential for an improvement in revenue isn't great enough to justify a higher P/S ratio. The company will need a change of fortune to justify the P/S rising higher in the future.
Many other vital risk factors can be found on the company's balance sheet. Take a look at our free balance sheet analysis for Qi An Xin Technology Group with six simple checks on some of these key factors.
It's important to make sure you look for a great company, not just the first idea you come across. So if growing profitability aligns with your idea of a great company, take a peek at this free list of interesting companies with strong recent earnings growth (and a low P/E).
Valuation is complex, but we're here to simplify it.
Discover if Qi An Xin Technology Group might be undervalued or overvalued with our detailed analysis, featuring fair value estimates, potential risks, dividends, insider trades, and its financial condition.
Access Free AnalysisHave feedback on this article? Concerned about the content? Get in touch with us directly. Alternatively, email editorial-team (at) simplywallst.com.
This article by Simply Wall St is general in nature. We provide commentary based on historical data and analyst forecasts only using an unbiased methodology and our articles are not intended to be financial advice. It does not constitute a recommendation to buy or sell any stock, and does not take account of your objectives, or your financial situation. We aim to bring you long-term focused analysis driven by fundamental data. Note that our analysis may not factor in the latest price-sensitive company announcements or qualitative material. Simply Wall St has no position in any stocks mentioned.
About SHSE:688561
Qi An Xin Technology Group
A cyber-security company, provides cybersecurity products and services for government, enterprises, and other institutions in China and internationally.
Excellent balance sheet and fair value.
Similar Companies
Market Insights

Advertisement
Community Narratives
MicroVision will explode future revenue by 380.37% with a vision towards success
Fair Value US$60.00|98.4% undervalued
TH
Community Contributor
The Indispensable Artery for a New North American Economy
Fair Value CA$132.87|1.3% undervalued
TI
Community Contributor