
Advertisement
Shanghai Golden Bridge InfoTech Co.,Ltd's (SHSE:603918) 92% Price Boost Is Out Of Tune With Revenues
Shanghai Golden Bridge InfoTech Co.,Ltd (SHSE:603918) shares have had a really impressive month, gaining 92% after a shaky period beforehand. The last 30 days bring the annual gain to a very sharp 61%.
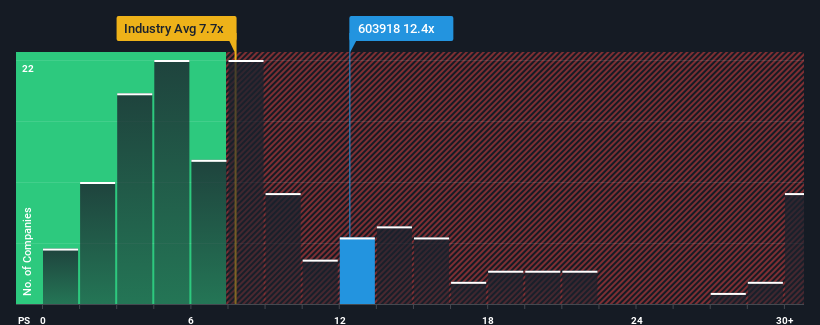
Since its price has surged higher, given around half the companies in China's Software industry have price-to-sales ratios (or "P/S") below 7.7x, you may consider Shanghai Golden Bridge InfoTechLtd as a stock to avoid entirely with its 12.4x P/S ratio. Although, it's not wise to just take the P/S at face value as there may be an explanation why it's so lofty.
Check out our latest analysis for Shanghai Golden Bridge InfoTechLtd
How Shanghai Golden Bridge InfoTechLtd Has Been Performing
For instance, Shanghai Golden Bridge InfoTechLtd's receding revenue in recent times would have to be some food for thought. Perhaps the market believes the company can do enough to outperform the rest of the industry in the near future, which is keeping the P/S ratio high. You'd really hope so, otherwise you're paying a pretty hefty price for no particular reason.
Want the full picture on earnings, revenue and cash flow for the company? Then our free report on Shanghai Golden Bridge InfoTechLtd will help you shine a light on its historical performance.Is There Enough Revenue Growth Forecasted For Shanghai Golden Bridge InfoTechLtd?
The only time you'd be truly comfortable seeing a P/S as steep as Shanghai Golden Bridge InfoTechLtd's is when the company's growth is on track to outshine the industry decidedly.
Taking a look back first, the company's revenue growth last year wasn't something to get excited about as it posted a disappointing decline of 30%. The last three years don't look nice either as the company has shrunk revenue by 37% in aggregate. Therefore, it's fair to say the revenue growth recently has been undesirable for the company.
In contrast to the company, the rest of the industry is expected to grow by 28% over the next year, which really puts the company's recent medium-term revenue decline into perspective.
With this in mind, we find it worrying that Shanghai Golden Bridge InfoTechLtd's P/S exceeds that of its industry peers. Apparently many investors in the company are way more bullish than recent times would indicate and aren't willing to let go of their stock at any price. There's a very good chance existing shareholders are setting themselves up for future disappointment if the P/S falls to levels more in line with the recent negative growth rates.
The Final Word
Shares in Shanghai Golden Bridge InfoTechLtd have seen a strong upwards swing lately, which has really helped boost its P/S figure. It's argued the price-to-sales ratio is an inferior measure of value within certain industries, but it can be a powerful business sentiment indicator.
Our examination of Shanghai Golden Bridge InfoTechLtd revealed its shrinking revenue over the medium-term isn't resulting in a P/S as low as we expected, given the industry is set to grow. With a revenue decline on investors' minds, the likelihood of a souring sentiment is quite high which could send the P/S back in line with what we'd expect. Unless the recent medium-term conditions improve markedly, investors will have a hard time accepting the share price as fair value.
There are also other vital risk factors to consider and we've discovered 2 warning signs for Shanghai Golden Bridge InfoTechLtd (1 is a bit unpleasant!) that you should be aware of before investing here.
If you're unsure about the strength of Shanghai Golden Bridge InfoTechLtd's business, why not explore our interactive list of stocks with solid business fundamentals for some other companies you may have missed.
New: Manage All Your Stock Portfolios in One Place
We've created the ultimate portfolio companion for stock investors, and it's free.
• Connect an unlimited number of Portfolios and see your total in one currency
• Be alerted to new Warning Signs or Risks via email or mobile
• Track the Fair Value of your stocks
Have feedback on this article? Concerned about the content? Get in touch with us directly. Alternatively, email editorial-team (at) simplywallst.com.
This article by Simply Wall St is general in nature. We provide commentary based on historical data and analyst forecasts only using an unbiased methodology and our articles are not intended to be financial advice. It does not constitute a recommendation to buy or sell any stock, and does not take account of your objectives, or your financial situation. We aim to bring you long-term focused analysis driven by fundamental data. Note that our analysis may not factor in the latest price-sensitive company announcements or qualitative material. Simply Wall St has no position in any stocks mentioned.
About SHSE:603918
Shanghai Golden Bridge InfoTechLtd
Provides smart space information solutions and services in China.
High growth potential with excellent balance sheet.
Market Insights

Advertisement
Community Narratives
MicroVision will explode future revenue by 380.37% with a vision towards success
Fair Value US$60.00|98.5% undervalued
TH
Community Contributor
The Indispensable Artery for a New North American Economy
Fair Value CA$132.87|2.3% undervalued
TI
Community Contributor