
Advertisement
There Are Reasons To Feel Uneasy About Bestlink TechnologiesLtd's (SHSE:603206) Returns On Capital
If we want to find a potential multi-bagger, often there are underlying trends that can provide clues. In a perfect world, we'd like to see a company investing more capital into its business and ideally the returns earned from that capital are also increasing. Put simply, these types of businesses are compounding machines, meaning they are continually reinvesting their earnings at ever-higher rates of return. Having said that, from a first glance at Bestlink TechnologiesLtd (SHSE:603206) we aren't jumping out of our chairs at how returns are trending, but let's have a deeper look.
Understanding Return On Capital Employed (ROCE)
For those who don't know, ROCE is a measure of a company's yearly pre-tax profit (its return), relative to the capital employed in the business. Analysts use this formula to calculate it for Bestlink TechnologiesLtd:
Return on Capital Employed = Earnings Before Interest and Tax (EBIT) ÷ (Total Assets - Current Liabilities)
0.072 = CN¥162m ÷ (CN¥6.7b - CN¥4.4b) (Based on the trailing twelve months to September 2024).
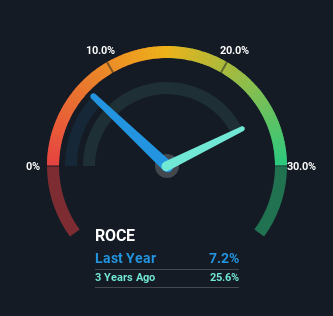
So, Bestlink TechnologiesLtd has an ROCE of 7.2%. On its own that's a low return, but compared to the average of 3.7% generated by the IT industry, it's much better.
View our latest analysis for Bestlink TechnologiesLtd
While the past is not representative of the future, it can be helpful to know how a company has performed historically, which is why we have this chart above. If you'd like to look at how Bestlink TechnologiesLtd has performed in the past in other metrics, you can view this free graph of Bestlink TechnologiesLtd's past earnings, revenue and cash flow.
How Are Returns Trending?
When we looked at the ROCE trend at Bestlink TechnologiesLtd, we didn't gain much confidence. Over the last five years, returns on capital have decreased to 7.2% from 22% five years ago. Although, given both revenue and the amount of assets employed in the business have increased, it could suggest the company is investing in growth, and the extra capital has led to a short-term reduction in ROCE. And if the increased capital generates additional returns, the business, and thus shareholders, will benefit in the long run.
On a separate but related note, it's important to know that Bestlink TechnologiesLtd has a current liabilities to total assets ratio of 66%, which we'd consider pretty high. This effectively means that suppliers (or short-term creditors) are funding a large portion of the business, so just be aware that this can introduce some elements of risk. Ideally we'd like to see this reduce as that would mean fewer obligations bearing risks.
In Conclusion...
Even though returns on capital have fallen in the short term, we find it promising that revenue and capital employed have both increased for Bestlink TechnologiesLtd. And the stock has followed suit returning a meaningful 12% to shareholders over the last year. So should these growth trends continue, we'd be optimistic on the stock going forward.
One final note, you should learn about the 3 warning signs we've spotted with Bestlink TechnologiesLtd (including 1 which shouldn't be ignored) .
For those who like to invest in solid companies, check out this free list of companies with solid balance sheets and high returns on equity.
Valuation is complex, but we're here to simplify it.
Discover if Bestlink TechnologiesLtd might be undervalued or overvalued with our detailed analysis, featuring fair value estimates, potential risks, dividends, insider trades, and its financial condition.
Access Free AnalysisHave feedback on this article? Concerned about the content? Get in touch with us directly. Alternatively, email editorial-team (at) simplywallst.com.
This article by Simply Wall St is general in nature. We provide commentary based on historical data and analyst forecasts only using an unbiased methodology and our articles are not intended to be financial advice. It does not constitute a recommendation to buy or sell any stock, and does not take account of your objectives, or your financial situation. We aim to bring you long-term focused analysis driven by fundamental data. Note that our analysis may not factor in the latest price-sensitive company announcements or qualitative material. Simply Wall St has no position in any stocks mentioned.
About SHSE:603206
Bestlink TechnologiesLtd
Provides information and communication technology services in China.
Slight risk with imperfect balance sheet.
Market Insights

Advertisement
Community Narratives
MicroVision will explode future revenue by 380.37% with a vision towards success
Fair Value US$60.00|98.4% undervalued
TH
Community Contributor
The Indispensable Artery for a New North American Economy
Fair Value CA$132.87|1.3% undervalued
TI
Community Contributor