The three-year decline in earnings might be taking its toll on INESA Intelligent Tech (SHSE:600602) shareholders as stock falls 4.4% over the past week


The most you can lose on any stock (assuming you don't use leverage) is 100% of your money. But in contrast you can make much more than 100% if the company does well. For example, the INESA Intelligent Tech Inc. (SHSE:600602) share price has soared 108% in the last three years. Most would be happy with that. But it's down 4.4% in the last week. But this could be related to the soft market, with stocks selling off around 0.6% in the last week.
In light of the stock dropping 4.4% in the past week, we want to investigate the longer term story, and see if fundamentals have been the driver of the company's positive three-year return.
View our latest analysis for INESA Intelligent Tech
While markets are a powerful pricing mechanism, share prices reflect investor sentiment, not just underlying business performance. One flawed but reasonable way to assess how sentiment around a company has changed is to compare the earnings per share (EPS) with the share price.
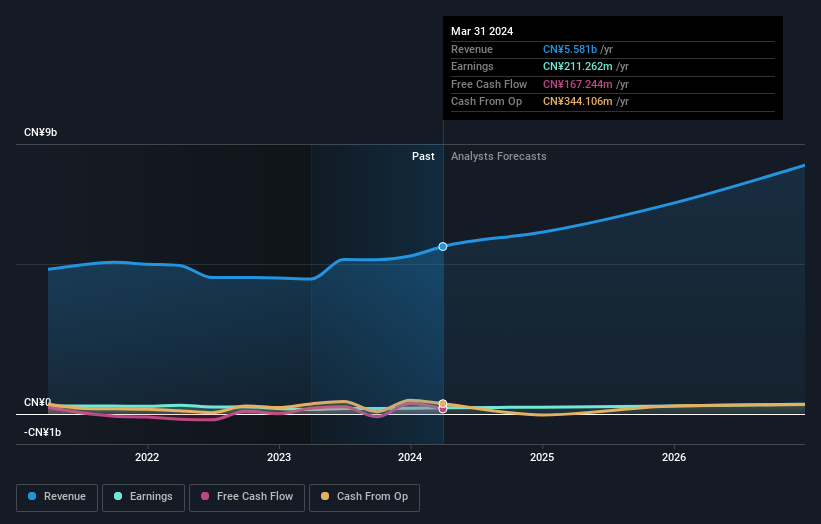
During the three years of share price growth, INESA Intelligent Tech actually saw its earnings per share (EPS) drop 7.0% per year.
Thus, it seems unlikely that the market is focussed on EPS growth at the moment. Given this situation, it makes sense to look at other metrics too.
The modest 0.4% dividend yield is unlikely to be propping up the share price. Do you think that shareholders are buying for the 2.6% per annum revenue growth trend? We don't. While we don't have an obvious theory to explain the share price rise, a closer look at the data might be enlightening.
The image below shows how earnings and revenue have tracked over time (if you click on the image you can see greater detail).
We're pleased to report that the CEO is remunerated more modestly than most CEOs at similarly capitalized companies. It's always worth keeping an eye on CEO pay, but a more important question is whether the company will grow earnings throughout the years. So it makes a lot of sense to check out what analysts think INESA Intelligent Tech will earn in the future (free profit forecasts).
What About Dividends?
It is important to consider the total shareholder return, as well as the share price return, for any given stock. Whereas the share price return only reflects the change in the share price, the TSR includes the value of dividends (assuming they were reinvested) and the benefit of any discounted capital raising or spin-off. It's fair to say that the TSR gives a more complete picture for stocks that pay a dividend. In the case of INESA Intelligent Tech, it has a TSR of 113% for the last 3 years. That exceeds its share price return that we previously mentioned. The dividends paid by the company have thusly boosted the total shareholder return.
A Different Perspective
We're pleased to report that INESA Intelligent Tech shareholders have received a total shareholder return of 28% over one year. That's including the dividend. Since the one-year TSR is better than the five-year TSR (the latter coming in at 8% per year), it would seem that the stock's performance has improved in recent times. Someone with an optimistic perspective could view the recent improvement in TSR as indicating that the business itself is getting better with time. Before forming an opinion on INESA Intelligent Tech you might want to consider these 3 valuation metrics.
But note: INESA Intelligent Tech may not be the best stock to buy. So take a peek at this free list of interesting companies with past earnings growth (and further growth forecast).
Please note, the market returns quoted in this article reflect the market weighted average returns of stocks that currently trade on Chinese exchanges.
New: AI Stock Screener & Alerts
Our new AI Stock Screener scans the market every day to uncover opportunities.
• Dividend Powerhouses (3%+ Yield)
• Undervalued Small Caps with Insider Buying
• High growth Tech and AI Companies
Or build your own from over 50 metrics.
Have feedback on this article? Concerned about the content? Get in touch with us directly. Alternatively, email editorial-team (at) simplywallst.com.
This article by Simply Wall St is general in nature. We provide commentary based on historical data and analyst forecasts only using an unbiased methodology and our articles are not intended to be financial advice. It does not constitute a recommendation to buy or sell any stock, and does not take account of your objectives, or your financial situation. We aim to bring you long-term focused analysis driven by fundamental data. Note that our analysis may not factor in the latest price-sensitive company announcements or qualitative material. Simply Wall St has no position in any stocks mentioned.
About SHSE:600602
INESA Intelligent Tech
Operates as an information technology services company in China.
Excellent balance sheet with acceptable track record.

