
Advertisement
- China
- /
- Semiconductors
- /
- SZSE:300752
Shenzhen Longli Technology Co.,Ltd (SZSE:300752) Surges 43% Yet Its Low P/S Is No Reason For Excitement
Shenzhen Longli Technology Co.,Ltd (SZSE:300752) shares have had a really impressive month, gaining 43% after a shaky period beforehand. Unfortunately, the gains of the last month did little to right the losses of the last year with the stock still down 10% over that time.
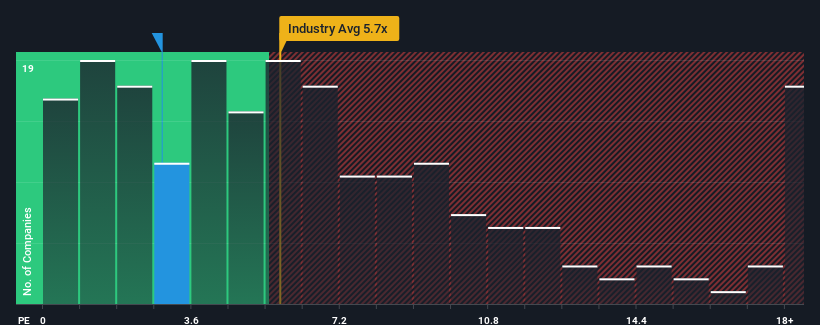
Although its price has surged higher, Shenzhen Longli TechnologyLtd may still be sending buy signals at present with its price-to-sales (or "P/S") ratio of 2.9x, considering almost half of all companies in the Semiconductor industry in China have P/S ratios greater than 5.7x and even P/S higher than 10x aren't out of the ordinary. Nonetheless, we'd need to dig a little deeper to determine if there is a rational basis for the reduced P/S.
See our latest analysis for Shenzhen Longli TechnologyLtd
What Does Shenzhen Longli TechnologyLtd's P/S Mean For Shareholders?
Shenzhen Longli TechnologyLtd has been doing a decent job lately as it's been growing revenue at a reasonable pace. Perhaps the market believes the recent revenue performance might fall short of industry figures in the near future, leading to a reduced P/S. If you like the company, you'd be hoping this isn't the case so that you could potentially pick up some stock while it's out of favour.
Although there are no analyst estimates available for Shenzhen Longli TechnologyLtd, take a look at this free data-rich visualisation to see how the company stacks up on earnings, revenue and cash flow.What Are Revenue Growth Metrics Telling Us About The Low P/S?
The only time you'd be truly comfortable seeing a P/S as low as Shenzhen Longli TechnologyLtd's is when the company's growth is on track to lag the industry.
Taking a look back first, we see that the company managed to grow revenues by a handy 6.7% last year. However, this wasn't enough as the latest three year period has seen an unpleasant 42% overall drop in revenue. Therefore, it's fair to say the revenue growth recently has been undesirable for the company.
Comparing that to the industry, which is predicted to deliver 36% growth in the next 12 months, the company's downward momentum based on recent medium-term revenue results is a sobering picture.
In light of this, it's understandable that Shenzhen Longli TechnologyLtd's P/S would sit below the majority of other companies. However, we think shrinking revenues are unlikely to lead to a stable P/S over the longer term, which could set up shareholders for future disappointment. There's potential for the P/S to fall to even lower levels if the company doesn't improve its top-line growth.
The Key Takeaway
Shenzhen Longli TechnologyLtd's stock price has surged recently, but its but its P/S still remains modest. It's argued the price-to-sales ratio is an inferior measure of value within certain industries, but it can be a powerful business sentiment indicator.
As we suspected, our examination of Shenzhen Longli TechnologyLtd revealed its shrinking revenue over the medium-term is contributing to its low P/S, given the industry is set to grow. At this stage investors feel the potential for an improvement in revenue isn't great enough to justify a higher P/S ratio. Given the current circumstances, it seems unlikely that the share price will experience any significant movement in either direction in the near future if recent medium-term revenue trends persist.
Before you take the next step, you should know about the 3 warning signs for Shenzhen Longli TechnologyLtd that we have uncovered.
If companies with solid past earnings growth is up your alley, you may wish to see this free collection of other companies with strong earnings growth and low P/E ratios.
New: Manage All Your Stock Portfolios in One Place
We've created the ultimate portfolio companion for stock investors, and it's free.
• Connect an unlimited number of Portfolios and see your total in one currency
• Be alerted to new Warning Signs or Risks via email or mobile
• Track the Fair Value of your stocks
Have feedback on this article? Concerned about the content? Get in touch with us directly. Alternatively, email editorial-team (at) simplywallst.com.
This article by Simply Wall St is general in nature. We provide commentary based on historical data and analyst forecasts only using an unbiased methodology and our articles are not intended to be financial advice. It does not constitute a recommendation to buy or sell any stock, and does not take account of your objectives, or your financial situation. We aim to bring you long-term focused analysis driven by fundamental data. Note that our analysis may not factor in the latest price-sensitive company announcements or qualitative material. Simply Wall St has no position in any stocks mentioned.
About SZSE:300752
Shenzhen Longli TechnologyLtd
Engages in the research and development, production, and sale of LED backlight display modules in China and internationally.
Exceptional growth potential with flawless balance sheet.
Similar Companies
Market Insights

Advertisement
Community Narratives
MicroVision will explode future revenue by 380.37% with a vision towards success
Fair Value US$60.00|98.3% undervalued
TH
Community Contributor
The Indispensable Artery for a New North American Economy
Fair Value CA$132.87|1.0% undervalued
TI
Community Contributor