- China
- /
- Semiconductors
- /
- SZSE:300554
NanJing Sanchao Advanced Materials Co.,Ltd.'s (SZSE:300554) Fundamentals Look Pretty Strong: Could The Market Be Wrong About The Stock?


It is hard to get excited after looking at NanJing Sanchao Advanced MaterialsLtd's (SZSE:300554) recent performance, when its stock has declined 11% over the past week. However, the company's fundamentals look pretty decent, and long-term financials are usually aligned with future market price movements. In this article, we decided to focus on NanJing Sanchao Advanced MaterialsLtd's ROE.
ROE or return on equity is a useful tool to assess how effectively a company can generate returns on the investment it received from its shareholders. In simpler terms, it measures the profitability of a company in relation to shareholder's equity.
Check out our latest analysis for NanJing Sanchao Advanced MaterialsLtd
How Is ROE Calculated?
ROE can be calculated by using the formula:
Return on Equity = Net Profit (from continuing operations) ÷ Shareholders' Equity
So, based on the above formula, the ROE for NanJing Sanchao Advanced MaterialsLtd is:
3.2% = CN¥26m ÷ CN¥824m (Based on the trailing twelve months to March 2024).
The 'return' refers to a company's earnings over the last year. Another way to think of that is that for every CN¥1 worth of equity, the company was able to earn CN¥0.03 in profit.
What Is The Relationship Between ROE And Earnings Growth?
So far, we've learned that ROE is a measure of a company's profitability. Based on how much of its profits the company chooses to reinvest or "retain", we are then able to evaluate a company's future ability to generate profits. Assuming all else is equal, companies that have both a higher return on equity and higher profit retention are usually the ones that have a higher growth rate when compared to companies that don't have the same features.
NanJing Sanchao Advanced MaterialsLtd's Earnings Growth And 3.2% ROE
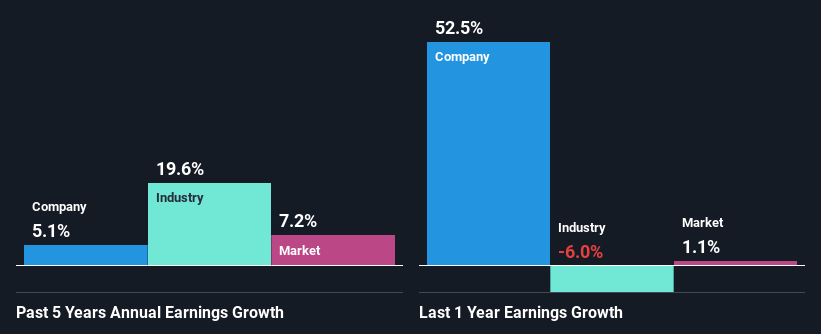
It is quite clear that NanJing Sanchao Advanced MaterialsLtd's ROE is rather low. Even when compared to the industry average of 5.8%, the ROE figure is pretty disappointing. Although, we can see that NanJing Sanchao Advanced MaterialsLtd saw a modest net income growth of 5.1% over the past five years. Therefore, the growth in earnings could probably have been caused by other variables. For instance, the company has a low payout ratio or is being managed efficiently.
As a next step, we compared NanJing Sanchao Advanced MaterialsLtd's net income growth with the industry and were disappointed to see that the company's growth is lower than the industry average growth of 20% in the same period.
The basis for attaching value to a company is, to a great extent, tied to its earnings growth. It’s important for an investor to know whether the market has priced in the company's expected earnings growth (or decline). By doing so, they will have an idea if the stock is headed into clear blue waters or if swampy waters await. If you're wondering about NanJing Sanchao Advanced MaterialsLtd's's valuation, check out this gauge of its price-to-earnings ratio, as compared to its industry.
Is NanJing Sanchao Advanced MaterialsLtd Using Its Retained Earnings Effectively?
NanJing Sanchao Advanced MaterialsLtd has a three-year median payout ratio of 31%, which implies that it retains the remaining 69% of its profits. This suggests that its dividend is well covered, and given the decent growth seen by the company, it looks like management is reinvesting its earnings efficiently.
Besides, NanJing Sanchao Advanced MaterialsLtd has been paying dividends over a period of six years. This shows that the company is committed to sharing profits with its shareholders.
Summary
On the whole, we do feel that NanJing Sanchao Advanced MaterialsLtd has some positive attributes. That is, a decent growth in earnings backed by a high rate of reinvestment. However, we do feel that that earnings growth could have been higher if the business were to improve on the low ROE rate. Especially given how the company is reinvesting a huge chunk of its profits. While we won't completely dismiss the company, what we would do, is try to ascertain how risky the business is to make a more informed decision around the company. To know the 1 risk we have identified for NanJing Sanchao Advanced MaterialsLtd visit our risks dashboard for free.
Valuation is complex, but we're here to simplify it.
Discover if NanJing Sanchao Advanced MaterialsLtd might be undervalued or overvalued with our detailed analysis, featuring fair value estimates, potential risks, dividends, insider trades, and its financial condition.
Access Free AnalysisHave feedback on this article? Concerned about the content? Get in touch with us directly. Alternatively, email editorial-team (at) simplywallst.com.
This article by Simply Wall St is general in nature. We provide commentary based on historical data and analyst forecasts only using an unbiased methodology and our articles are not intended to be financial advice. It does not constitute a recommendation to buy or sell any stock, and does not take account of your objectives, or your financial situation. We aim to bring you long-term focused analysis driven by fundamental data. Note that our analysis may not factor in the latest price-sensitive company announcements or qualitative material. Simply Wall St has no position in any stocks mentioned.
Have feedback on this article? Concerned about the content? Get in touch with us directly. Alternatively, email editorial-team@simplywallst.com
About SZSE:300554
NanJing Sanchao Advanced MaterialsLtd
NanJing Sanchao Advanced Materials Co.,Ltd.
Solid track record with adequate balance sheet.
