Miracll Chemicals Co.,Ltd's (SZSE:300848) Stock Has Shown Weakness Lately But Financial Prospects Look Decent: Is The Market Wrong?


Miracll ChemicalsLtd (SZSE:300848) has had a rough three months with its share price down 21%. However, the company's fundamentals look pretty decent, and long-term financials are usually aligned with future market price movements. Specifically, we decided to study Miracll ChemicalsLtd's ROE in this article.
Return on equity or ROE is a key measure used to assess how efficiently a company's management is utilizing the company's capital. In short, ROE shows the profit each dollar generates with respect to its shareholder investments.
See our latest analysis for Miracll ChemicalsLtd
How To Calculate Return On Equity?
The formula for return on equity is:
Return on Equity = Net Profit (from continuing operations) ÷ Shareholders' Equity
So, based on the above formula, the ROE for Miracll ChemicalsLtd is:
5.1% = CN¥77m ÷ CN¥1.5b (Based on the trailing twelve months to March 2024).
The 'return' is the amount earned after tax over the last twelve months. One way to conceptualize this is that for each CN¥1 of shareholders' capital it has, the company made CN¥0.05 in profit.
Why Is ROE Important For Earnings Growth?
So far, we've learned that ROE is a measure of a company's profitability. Depending on how much of these profits the company reinvests or "retains", and how effectively it does so, we are then able to assess a company’s earnings growth potential. Generally speaking, other things being equal, firms with a high return on equity and profit retention, have a higher growth rate than firms that don’t share these attributes.
A Side By Side comparison of Miracll ChemicalsLtd's Earnings Growth And 5.1% ROE
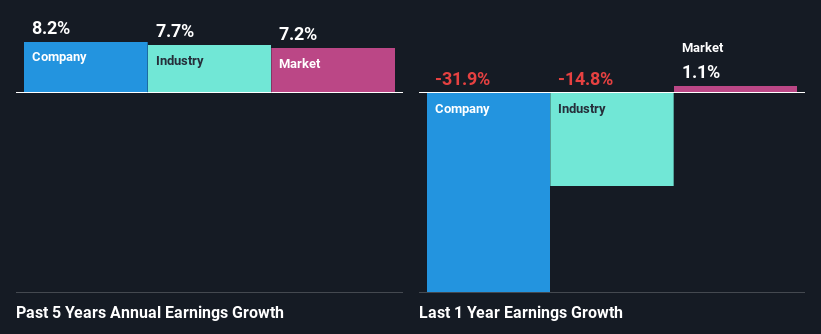
On the face of it, Miracll ChemicalsLtd's ROE is not much to talk about. We then compared the company's ROE to the broader industry and were disappointed to see that the ROE is lower than the industry average of 6.4%. Miracll ChemicalsLtd was still able to see a decent net income growth of 8.2% over the past five years. So, there might be other aspects that are positively influencing the company's earnings growth. For instance, the company has a low payout ratio or is being managed efficiently.
We then performed a comparison between Miracll ChemicalsLtd's net income growth with the industry, which revealed that the company's growth is similar to the average industry growth of 7.7% in the same 5-year period.
Earnings growth is a huge factor in stock valuation. What investors need to determine next is if the expected earnings growth, or the lack of it, is already built into the share price. Doing so will help them establish if the stock's future looks promising or ominous. Is Miracll ChemicalsLtd fairly valued compared to other companies? These 3 valuation measures might help you decide.
Is Miracll ChemicalsLtd Efficiently Re-investing Its Profits?
Miracll ChemicalsLtd has a low three-year median payout ratio of 20%, meaning that the company retains the remaining 80% of its profits. This suggests that the management is reinvesting most of the profits to grow the business.
Additionally, Miracll ChemicalsLtd has paid dividends over a period of three years which means that the company is pretty serious about sharing its profits with shareholders.
Summary
On the whole, we do feel that Miracll ChemicalsLtd has some positive attributes. With a high rate of reinvestment, albeit at a low ROE, the company has managed to see a considerable growth in its earnings. That being so, the latest analyst forecasts show that the company will continue to see an expansion in its earnings. To know more about the company's future earnings growth forecasts take a look at this free report on analyst forecasts for the company to find out more.
New: Manage All Your Stock Portfolios in One Place
We've created the ultimate portfolio companion for stock investors, and it's free.
• Connect an unlimited number of Portfolios and see your total in one currency
• Be alerted to new Warning Signs or Risks via email or mobile
• Track the Fair Value of your stocks
Have feedback on this article? Concerned about the content? Get in touch with us directly. Alternatively, email editorial-team (at) simplywallst.com.
This article by Simply Wall St is general in nature. We provide commentary based on historical data and analyst forecasts only using an unbiased methodology and our articles are not intended to be financial advice. It does not constitute a recommendation to buy or sell any stock, and does not take account of your objectives, or your financial situation. We aim to bring you long-term focused analysis driven by fundamental data. Note that our analysis may not factor in the latest price-sensitive company announcements or qualitative material. Simply Wall St has no position in any stocks mentioned.
Have feedback on this article? Concerned about the content? Get in touch with us directly. Alternatively, email editorial-team@simplywallst.com
About SZSE:300848
Miracll ChemicalsLtd
Researches, develops, manufactures, and sells thermoplastic polyurethane (TPU) elastomers.
High growth potential with adequate balance sheet.
