- China
- /
- Semiconductors
- /
- SZSE:300046
Risks Still Elevated At These Prices As Tech Semiconductors Co., Ltd. (SZSE:300046) Shares Dive 26%
Tech Semiconductors Co., Ltd. (SZSE:300046) shares have retraced a considerable 26% in the last month, reversing a fair amount of their solid recent performance. The good news is that in the last year, the stock has shone bright like a diamond, gaining 136%.
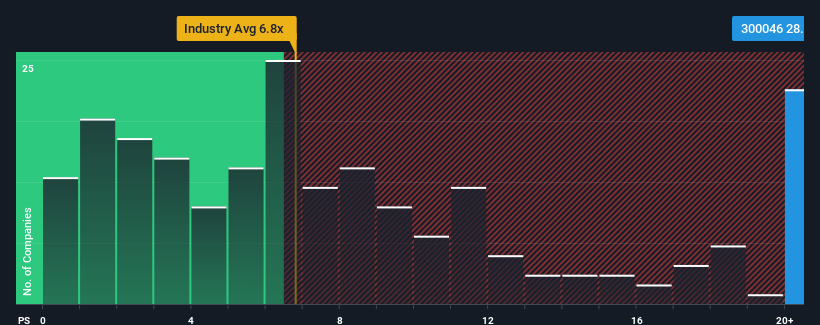
In spite of the heavy fall in price, Tech Semiconductors may still be sending very bearish signals at the moment with a price-to-sales (or "P/S") ratio of 28x, since almost half of all companies in the Semiconductor industry in China have P/S ratios under 6.8x and even P/S lower than 3x are not unusual. Nonetheless, we'd need to dig a little deeper to determine if there is a rational basis for the highly elevated P/S.
See our latest analysis for Tech Semiconductors

How Has Tech Semiconductors Performed Recently?
For example, consider that Tech Semiconductors' financial performance has been pretty ordinary lately as revenue growth is non-existent. Perhaps the market believes that revenue growth will improve markedly over current levels, inflating the P/S ratio. However, if this isn't the case, investors might get caught out paying too much for the stock.
Although there are no analyst estimates available for Tech Semiconductors, take a look at this free data-rich visualisation to see how the company stacks up on earnings, revenue and cash flow.Is There Enough Revenue Growth Forecasted For Tech Semiconductors?
The only time you'd be truly comfortable seeing a P/S as steep as Tech Semiconductors' is when the company's growth is on track to outshine the industry decidedly.
If we review the last year of revenue, the company posted a result that saw barely any deviation from a year ago. This isn't what shareholders were looking for as it means they've been left with a 28% decline in revenue over the last three years in total. Therefore, it's fair to say the revenue growth recently has been undesirable for the company.
Weighing that medium-term revenue trajectory against the broader industry's one-year forecast for expansion of 45% shows it's an unpleasant look.
In light of this, it's alarming that Tech Semiconductors' P/S sits above the majority of other companies. Apparently many investors in the company are way more bullish than recent times would indicate and aren't willing to let go of their stock at any price. There's a very good chance existing shareholders are setting themselves up for future disappointment if the P/S falls to levels more in line with the recent negative growth rates.
The Key Takeaway
Even after such a strong price drop, Tech Semiconductors' P/S still exceeds the industry median significantly. It's argued the price-to-sales ratio is an inferior measure of value within certain industries, but it can be a powerful business sentiment indicator.
Our examination of Tech Semiconductors revealed its shrinking revenue over the medium-term isn't resulting in a P/S as low as we expected, given the industry is set to grow. When we see revenue heading backwards and underperforming the industry forecasts, we feel the possibility of the share price declining is very real, bringing the P/S back into the realm of reasonability. If recent medium-term revenue trends continue, it will place shareholders' investments at significant risk and potential investors in danger of paying an excessive premium.
Don't forget that there may be other risks. For instance, we've identified 3 warning signs for Tech Semiconductors (1 is a bit concerning) you should be aware of.
Of course, profitable companies with a history of great earnings growth are generally safer bets. So you may wish to see this free collection of other companies that have reasonable P/E ratios and have grown earnings strongly.
Valuation is complex, but we're here to simplify it.
Discover if Tech Semiconductors might be undervalued or overvalued with our detailed analysis, featuring fair value estimates, potential risks, dividends, insider trades, and its financial condition.
Access Free AnalysisHave feedback on this article? Concerned about the content? Get in touch with us directly. Alternatively, email editorial-team (at) simplywallst.com.
This article by Simply Wall St is general in nature. We provide commentary based on historical data and analyst forecasts only using an unbiased methodology and our articles are not intended to be financial advice. It does not constitute a recommendation to buy or sell any stock, and does not take account of your objectives, or your financial situation. We aim to bring you long-term focused analysis driven by fundamental data. Note that our analysis may not factor in the latest price-sensitive company announcements or qualitative material. Simply Wall St has no position in any stocks mentioned.
About SZSE:300046
Tech Semiconductors
Engages in the development, manufacture, and sale of power semiconductor devices in China.
Flawless balance sheet with solid track record.
Market Insights
Community Narratives


