
Advertisement
- China
- /
- Semiconductors
- /
- SHSE:688372
There's Reason For Concern Over Shanghai V-Test Semiconductor Tech. Co., Ltd.'s (SHSE:688372) Massive 25% Price Jump
Shanghai V-Test Semiconductor Tech. Co., Ltd. (SHSE:688372) shareholders would be excited to see that the share price has had a great month, posting a 25% gain and recovering from prior weakness. Looking back a bit further, it's encouraging to see the stock is up 26% in the last year.
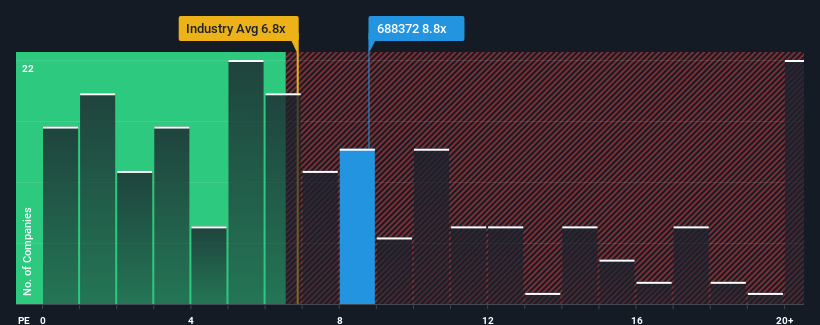
Following the firm bounce in price, Shanghai V-Test Semiconductor Tech's price-to-sales (or "P/S") ratio of 8.8x might make it look like a sell right now compared to the wider Semiconductor industry in China, where around half of the companies have P/S ratios below 6.8x and even P/S below 3x are quite common. Nonetheless, we'd need to dig a little deeper to determine if there is a rational basis for the elevated P/S.
See our latest analysis for Shanghai V-Test Semiconductor Tech
What Does Shanghai V-Test Semiconductor Tech's Recent Performance Look Like?
Shanghai V-Test Semiconductor Tech certainly has been doing a good job lately as it's been growing revenue more than most other companies. It seems that many are expecting the strong revenue performance to persist, which has raised the P/S. If not, then existing shareholders might be a little nervous about the viability of the share price.
If you'd like to see what analysts are forecasting going forward, you should check out our free report on Shanghai V-Test Semiconductor Tech.What Are Revenue Growth Metrics Telling Us About The High P/S?
There's an inherent assumption that a company should outperform the industry for P/S ratios like Shanghai V-Test Semiconductor Tech's to be considered reasonable.
Taking a look back first, we see that the company grew revenue by an impressive 36% last year. Pleasingly, revenue has also lifted 95% in aggregate from three years ago, thanks to the last 12 months of growth. Therefore, it's fair to say the revenue growth recently has been superb for the company.
Turning to the outlook, the next year should generate growth of 31% as estimated by the four analysts watching the company. That's shaping up to be materially lower than the 50% growth forecast for the broader industry.
With this in consideration, we believe it doesn't make sense that Shanghai V-Test Semiconductor Tech's P/S is outpacing its industry peers. Apparently many investors in the company are way more bullish than analysts indicate and aren't willing to let go of their stock at any price. Only the boldest would assume these prices are sustainable as this level of revenue growth is likely to weigh heavily on the share price eventually.
What Does Shanghai V-Test Semiconductor Tech's P/S Mean For Investors?
Shanghai V-Test Semiconductor Tech's P/S is on the rise since its shares have risen strongly. Generally, our preference is to limit the use of the price-to-sales ratio to establishing what the market thinks about the overall health of a company.
We've concluded that Shanghai V-Test Semiconductor Tech currently trades on a much higher than expected P/S since its forecast growth is lower than the wider industry. When we see a weak revenue outlook, we suspect the share price faces a much greater risk of declining, bringing back down the P/S figures. At these price levels, investors should remain cautious, particularly if things don't improve.
It's always necessary to consider the ever-present spectre of investment risk. We've identified 3 warning signs with Shanghai V-Test Semiconductor Tech (at least 1 which doesn't sit too well with us), and understanding these should be part of your investment process.
If companies with solid past earnings growth is up your alley, you may wish to see this free collection of other companies with strong earnings growth and low P/E ratios.
New: Manage All Your Stock Portfolios in One Place
We've created the ultimate portfolio companion for stock investors, and it's free.
• Connect an unlimited number of Portfolios and see your total in one currency
• Be alerted to new Warning Signs or Risks via email or mobile
• Track the Fair Value of your stocks
Have feedback on this article? Concerned about the content? Get in touch with us directly. Alternatively, email editorial-team (at) simplywallst.com.
This article by Simply Wall St is general in nature. We provide commentary based on historical data and analyst forecasts only using an unbiased methodology and our articles are not intended to be financial advice. It does not constitute a recommendation to buy or sell any stock, and does not take account of your objectives, or your financial situation. We aim to bring you long-term focused analysis driven by fundamental data. Note that our analysis may not factor in the latest price-sensitive company announcements or qualitative material. Simply Wall St has no position in any stocks mentioned.
About SHSE:688372
Shanghai V-Test Semiconductor Tech
Shanghai V-Test Semiconductor Tech. Co., Ltd.
Good value with reasonable growth potential.
Market Insights

Advertisement
Community Narratives
MicroVision will explode future revenue by 380.37% with a vision towards success
Fair Value US$60.00|98.5% undervalued
TH
Community Contributor
The Indispensable Artery for a New North American Economy
Fair Value CA$132.87|2.3% undervalued
TI
Community Contributor