- China
- /
- Semiconductors
- /
- SHSE:600732
Shanghai Aiko Solar EnergyLtd's (SHSE:600732) investors will be pleased with their splendid 112% return over the last five years

Some Shanghai Aiko Solar Energy Co.,Ltd. (SHSE:600732) shareholders are probably rather concerned to see the share price fall 32% over the last three months. But that scarcely detracts from the really solid long term returns generated by the company over five years. In fact, the share price is 108% higher today. Generally speaking the long term returns will give you a better idea of business quality than short periods can. Only time will tell if there is still too much optimism currently reflected in the share price. Unfortunately not all shareholders will have held it for the long term, so spare a thought for those caught in the 66% decline over the last twelve months.
Let's take a look at the underlying fundamentals over the longer term, and see if they've been consistent with shareholders returns.
See our latest analysis for Shanghai Aiko Solar EnergyLtd
While markets are a powerful pricing mechanism, share prices reflect investor sentiment, not just underlying business performance. One imperfect but simple way to consider how the market perception of a company has shifted is to compare the change in the earnings per share (EPS) with the share price movement.
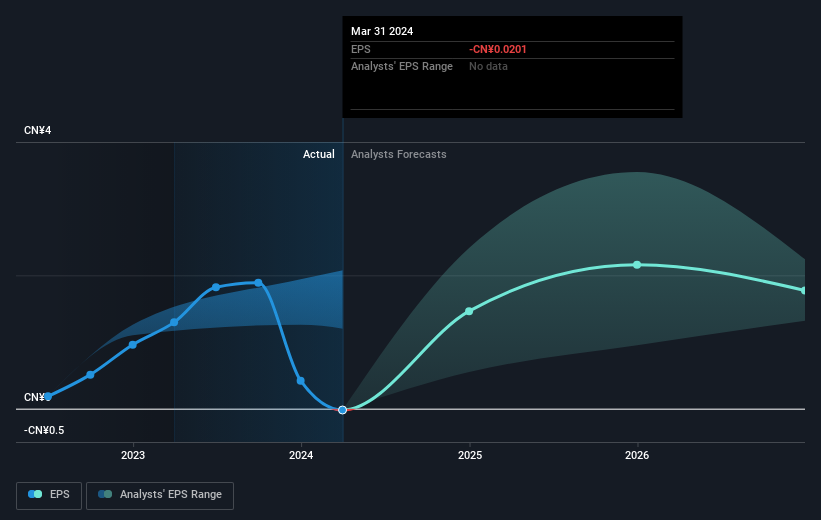
Over half a decade, Shanghai Aiko Solar EnergyLtd managed to grow its earnings per share at 40% a year. We do note that extraordinary items have impacted its earnings history. The EPS growth is more impressive than the yearly share price gain of 16% over the same period. Therefore, it seems the market has become relatively pessimistic about the company.
You can see below how EPS has changed over time (discover the exact values by clicking on the image).
It is of course excellent to see how Shanghai Aiko Solar EnergyLtd has grown profits over the years, but the future is more important for shareholders. Take a more thorough look at Shanghai Aiko Solar EnergyLtd's financial health with this free report on its balance sheet.
What About The Total Shareholder Return (TSR)?
Investors should note that there's a difference between Shanghai Aiko Solar EnergyLtd's total shareholder return (TSR) and its share price change, which we've covered above. The TSR attempts to capture the value of dividends (as if they were reinvested) as well as any spin-offs or discounted capital raisings offered to shareholders. Shanghai Aiko Solar EnergyLtd's TSR of 112% for the 5 years exceeded its share price return, because it has paid dividends.
A Different Perspective
We regret to report that Shanghai Aiko Solar EnergyLtd shareholders are down 66% for the year. Unfortunately, that's worse than the broader market decline of 15%. However, it could simply be that the share price has been impacted by broader market jitters. It might be worth keeping an eye on the fundamentals, in case there's a good opportunity. On the bright side, long term shareholders have made money, with a gain of 16% per year over half a decade. It could be that the recent sell-off is an opportunity, so it may be worth checking the fundamental data for signs of a long term growth trend. It's always interesting to track share price performance over the longer term. But to understand Shanghai Aiko Solar EnergyLtd better, we need to consider many other factors. Consider risks, for instance. Every company has them, and we've spotted 1 warning sign for Shanghai Aiko Solar EnergyLtd you should know about.
If you are like me, then you will not want to miss this free list of undervalued small caps that insiders are buying.
Please note, the market returns quoted in this article reflect the market weighted average returns of stocks that currently trade on Chinese exchanges.
New: Manage All Your Stock Portfolios in One Place
We've created the ultimate portfolio companion for stock investors, and it's free.
• Connect an unlimited number of Portfolios and see your total in one currency
• Be alerted to new Warning Signs or Risks via email or mobile
• Track the Fair Value of your stocks
Have feedback on this article? Concerned about the content? Get in touch with us directly. Alternatively, email editorial-team (at) simplywallst.com.
This article by Simply Wall St is general in nature. We provide commentary based on historical data and analyst forecasts only using an unbiased methodology and our articles are not intended to be financial advice. It does not constitute a recommendation to buy or sell any stock, and does not take account of your objectives, or your financial situation. We aim to bring you long-term focused analysis driven by fundamental data. Note that our analysis may not factor in the latest price-sensitive company announcements or qualitative material. Simply Wall St has no position in any stocks mentioned.
Have feedback on this article? Concerned about the content? Get in touch with us directly. Alternatively, email editorial-team@simplywallst.com
About SHSE:600732
Shanghai Aiko Solar EnergyLtd
Engages in the research, manufacture, and sale of crystalline silicon solar cells.
Exceptional growth potential and fair value.
