
Advertisement
- China
- /
- Semiconductors
- /
- SHSE:600732
Shanghai Aiko Solar Energy Co.,Ltd. (SHSE:600732) Stock Rockets 27% But Many Are Still Ignoring The Company
Shanghai Aiko Solar Energy Co.,Ltd. (SHSE:600732) shares have had a really impressive month, gaining 27% after a shaky period beforehand. But the last month did very little to improve the 54% share price decline over the last year.
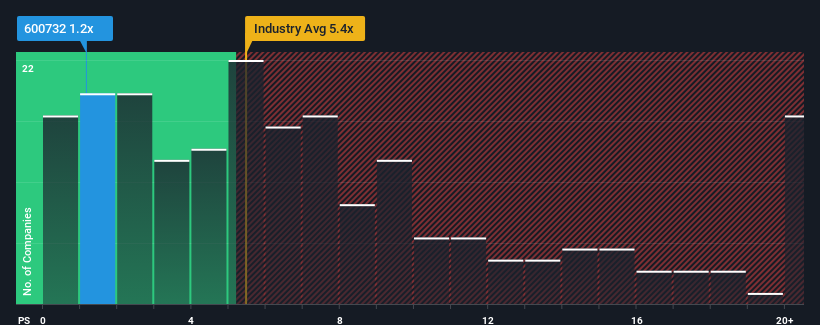
In spite of the firm bounce in price, Shanghai Aiko Solar EnergyLtd's price-to-sales (or "P/S") ratio of 1.2x might still make it look like a strong buy right now compared to the wider Semiconductor industry in China, where around half of the companies have P/S ratios above 5.4x and even P/S above 10x are quite common. However, the P/S might be quite low for a reason and it requires further investigation to determine if it's justified.
View our latest analysis for Shanghai Aiko Solar EnergyLtd
What Does Shanghai Aiko Solar EnergyLtd's P/S Mean For Shareholders?
Shanghai Aiko Solar EnergyLtd could be doing better as its revenue has been going backwards lately while most other companies have been seeing positive revenue growth. The P/S ratio is probably low because investors think this poor revenue performance isn't going to get any better. So while you could say the stock is cheap, investors will be looking for improvement before they see it as good value.
Keen to find out how analysts think Shanghai Aiko Solar EnergyLtd's future stacks up against the industry? In that case, our free report is a great place to start.How Is Shanghai Aiko Solar EnergyLtd's Revenue Growth Trending?
Shanghai Aiko Solar EnergyLtd's P/S ratio would be typical for a company that's expected to deliver very poor growth or even falling revenue, and importantly, perform much worse than the industry.
Retrospectively, the last year delivered a frustrating 54% decrease to the company's top line. That put a dampener on the good run it was having over the longer-term as its three-year revenue growth is still a noteworthy 25% in total. So we can start by confirming that the company has generally done a good job of growing revenue over that time, even though it had some hiccups along the way.
Shifting to the future, estimates from the eight analysts covering the company suggest revenue should grow by 77% over the next year. Meanwhile, the rest of the industry is forecast to only expand by 36%, which is noticeably less attractive.
With this in consideration, we find it intriguing that Shanghai Aiko Solar EnergyLtd's P/S sits behind most of its industry peers. Apparently some shareholders are doubtful of the forecasts and have been accepting significantly lower selling prices.
What We Can Learn From Shanghai Aiko Solar EnergyLtd's P/S?
Shares in Shanghai Aiko Solar EnergyLtd have risen appreciably however, its P/S is still subdued. It's argued the price-to-sales ratio is an inferior measure of value within certain industries, but it can be a powerful business sentiment indicator.
Shanghai Aiko Solar EnergyLtd's analyst forecasts revealed that its superior revenue outlook isn't contributing to its P/S anywhere near as much as we would have predicted. When we see strong growth forecasts like this, we can only assume potential risks are what might be placing significant pressure on the P/S ratio. While the possibility of the share price plunging seems unlikely due to the high growth forecasted for the company, the market does appear to have some hesitation.
We don't want to rain on the parade too much, but we did also find 2 warning signs for Shanghai Aiko Solar EnergyLtd (1 doesn't sit too well with us!) that you need to be mindful of.
Of course, profitable companies with a history of great earnings growth are generally safer bets. So you may wish to see this free collection of other companies that have reasonable P/E ratios and have grown earnings strongly.
New: Manage All Your Stock Portfolios in One Place
We've created the ultimate portfolio companion for stock investors, and it's free.
• Connect an unlimited number of Portfolios and see your total in one currency
• Be alerted to new Warning Signs or Risks via email or mobile
• Track the Fair Value of your stocks
Have feedback on this article? Concerned about the content? Get in touch with us directly. Alternatively, email editorial-team (at) simplywallst.com.
This article by Simply Wall St is general in nature. We provide commentary based on historical data and analyst forecasts only using an unbiased methodology and our articles are not intended to be financial advice. It does not constitute a recommendation to buy or sell any stock, and does not take account of your objectives, or your financial situation. We aim to bring you long-term focused analysis driven by fundamental data. Note that our analysis may not factor in the latest price-sensitive company announcements or qualitative material. Simply Wall St has no position in any stocks mentioned.
About SHSE:600732
Shanghai Aiko Solar EnergyLtd
Engages in the research, manufacture, and sale of crystalline silicon solar cells.
Exceptional growth potential and fair value.
Market Insights

Advertisement
Community Narratives
MicroVision will explode future revenue by 380.37% with a vision towards success
Fair Value US$60.00|98.5% undervalued
TH
Community Contributor
The Indispensable Artery for a New North American Economy
Fair Value CA$132.87|2.3% undervalued
TI
Community Contributor