- China
- /
- General Merchandise and Department Stores
- /
- SHSE:600697
Chang Chun Eurasia Group's (SHSE:600697) five-year decline in earnings translates into losses for shareholders


Chang Chun Eurasia Group Co., Ltd. (SHSE:600697) shareholders should be happy to see the share price up 11% in the last week. But if you look at the last five years the returns have not been good. After all, the share price is down 39% in that time, significantly under-performing the market.
While the stock has risen 11% in the past week but long term shareholders are still in the red, let's see what the fundamentals can tell us.
Check out our latest analysis for Chang Chun Eurasia Group
In his essay The Superinvestors of Graham-and-Doddsville Warren Buffett described how share prices do not always rationally reflect the value of a business. One imperfect but simple way to consider how the market perception of a company has shifted is to compare the change in the earnings per share (EPS) with the share price movement.
During five years of share price growth, Chang Chun Eurasia Group moved from a loss to profitability. Most would consider that to be a good thing, so it's counter-intuitive to see the share price declining. Other metrics may better explain the share price move.
The modest 1.0% dividend yield is unlikely to be guiding the market view of the stock. It could be that the revenue decline of 20% per year is viewed as evidence that Chang Chun Eurasia Group is shrinking. This has probably encouraged some shareholders to sell down the stock.
You can see below how earnings and revenue have changed over time (discover the exact values by clicking on the image).
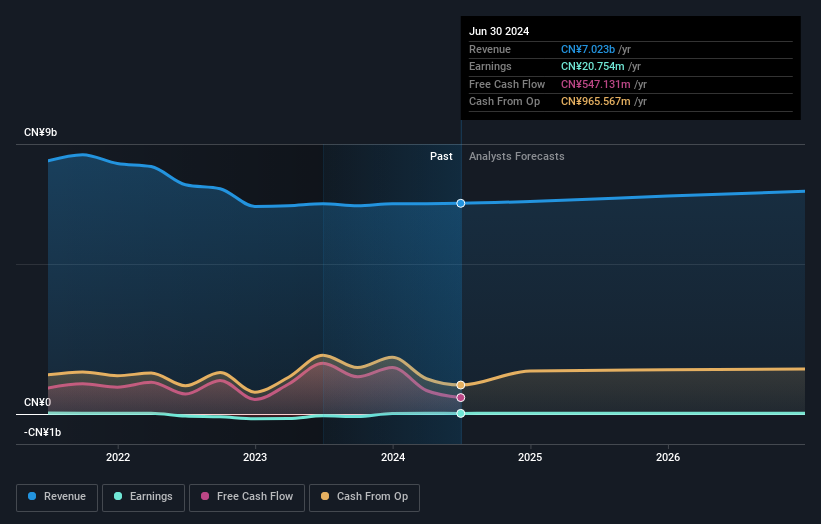
We know that Chang Chun Eurasia Group has improved its bottom line lately, but what does the future have in store? This free report showing analyst forecasts should help you form a view on Chang Chun Eurasia Group
What About Dividends?
It is important to consider the total shareholder return, as well as the share price return, for any given stock. The TSR incorporates the value of any spin-offs or discounted capital raisings, along with any dividends, based on the assumption that the dividends are reinvested. Arguably, the TSR gives a more comprehensive picture of the return generated by a stock. In the case of Chang Chun Eurasia Group, it has a TSR of -31% for the last 5 years. That exceeds its share price return that we previously mentioned. The dividends paid by the company have thusly boosted the total shareholder return.
A Different Perspective
While the broader market lost about 6.0% in the twelve months, Chang Chun Eurasia Group shareholders did even worse, losing 18% (even including dividends). However, it could simply be that the share price has been impacted by broader market jitters. It might be worth keeping an eye on the fundamentals, in case there's a good opportunity. Regrettably, last year's performance caps off a bad run, with the shareholders facing a total loss of 6% per year over five years. Generally speaking long term share price weakness can be a bad sign, though contrarian investors might want to research the stock in hope of a turnaround. I find it very interesting to look at share price over the long term as a proxy for business performance. But to truly gain insight, we need to consider other information, too. For instance, we've identified 2 warning signs for Chang Chun Eurasia Group (1 makes us a bit uncomfortable) that you should be aware of.
If you would prefer to check out another company -- one with potentially superior financials -- then do not miss this free list of companies that have proven they can grow earnings.
Please note, the market returns quoted in this article reflect the market weighted average returns of stocks that currently trade on Chinese exchanges.
New: AI Stock Screener & Alerts
Our new AI Stock Screener scans the market every day to uncover opportunities.
• Dividend Powerhouses (3%+ Yield)
• Undervalued Small Caps with Insider Buying
• High growth Tech and AI Companies
Or build your own from over 50 metrics.
Have feedback on this article? Concerned about the content? Get in touch with us directly. Alternatively, email editorial-team (at) simplywallst.com.
This article by Simply Wall St is general in nature. We provide commentary based on historical data and analyst forecasts only using an unbiased methodology and our articles are not intended to be financial advice. It does not constitute a recommendation to buy or sell any stock, and does not take account of your objectives, or your financial situation. We aim to bring you long-term focused analysis driven by fundamental data. Note that our analysis may not factor in the latest price-sensitive company announcements or qualitative material. Simply Wall St has no position in any stocks mentioned.
About SHSE:600697
Chang Chun Eurasia Group
Operates a chain of supermarkets and department stores in China.
Second-rate dividend payer with questionable track record.

