
Advertisement
- China
- /
- Real Estate
- /
- SZSE:000897
Tianjin Jinbin DevelopmentLtd's (SZSE:000897) Profits May Not Reveal Underlying Issues
Tianjin Jinbin Development Co.,Ltd's (SZSE:000897) healthy profit numbers didn't contain any surprises for investors. However the statutory profit number doesn't tell the whole story, and we have found some factors which might be of concern to shareholders.
See our latest analysis for Tianjin Jinbin DevelopmentLtd
Examining Cashflow Against Tianjin Jinbin DevelopmentLtd's Earnings
In high finance, the key ratio used to measure how well a company converts reported profits into free cash flow (FCF) is the accrual ratio (from cashflow). The accrual ratio subtracts the FCF from the profit for a given period, and divides the result by the average operating assets of the company over that time. You could think of the accrual ratio from cashflow as the 'non-FCF profit ratio'.
As a result, a negative accrual ratio is a positive for the company, and a positive accrual ratio is a negative. While having an accrual ratio above zero is of little concern, we do think it's worth noting when a company has a relatively high accrual ratio. Notably, there is some academic evidence that suggests that a high accrual ratio is a bad sign for near-term profits, generally speaking.
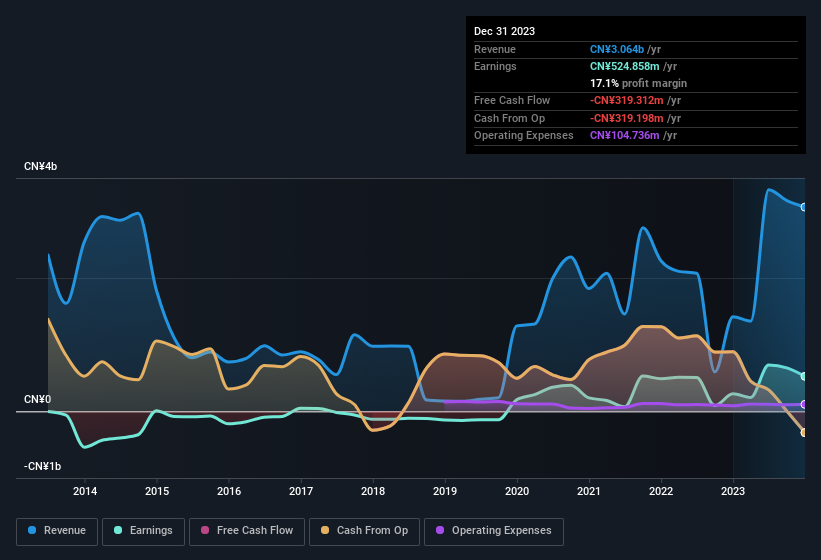
For the year to December 2023, Tianjin Jinbin DevelopmentLtd had an accrual ratio of 0.65. Statistically speaking, that's a real negative for future earnings. To wit, the company did not generate one whit of free cashflow in that time. Over the last year it actually had negative free cash flow of CN¥319m, in contrast to the aforementioned profit of CN¥524.9m. It's worth noting that Tianjin Jinbin DevelopmentLtd generated positive FCF of CN¥893m a year ago, so at least they've done it in the past. One positive for Tianjin Jinbin DevelopmentLtd shareholders is that it's accrual ratio was significantly better last year, providing reason to believe that it may return to stronger cash conversion in the future. Shareholders should look for improved cashflow relative to profit in the current year, if that is indeed the case.
Note: we always recommend investors check balance sheet strength. Click here to be taken to our balance sheet analysis of Tianjin Jinbin DevelopmentLtd.
Our Take On Tianjin Jinbin DevelopmentLtd's Profit Performance
As we have made quite clear, we're a bit worried that Tianjin Jinbin DevelopmentLtd didn't back up the last year's profit with free cashflow. As a result, we think it may well be the case that Tianjin Jinbin DevelopmentLtd's underlying earnings power is lower than its statutory profit. But the good news is that its EPS growth over the last three years has been very impressive. Of course, we've only just scratched the surface when it comes to analysing its earnings; one could also consider margins, forecast growth, and return on investment, among other factors. So if you'd like to dive deeper into this stock, it's crucial to consider any risks it's facing. You'd be interested to know, that we found 1 warning sign for Tianjin Jinbin DevelopmentLtd and you'll want to know about it.
Today we've zoomed in on a single data point to better understand the nature of Tianjin Jinbin DevelopmentLtd's profit. But there are plenty of other ways to inform your opinion of a company. For example, many people consider a high return on equity as an indication of favorable business economics, while others like to 'follow the money' and search out stocks that insiders are buying. While it might take a little research on your behalf, you may find this free collection of companies boasting high return on equity, or this list of stocks that insiders are buying to be useful.
Valuation is complex, but we're here to simplify it.
Discover if Tianjin Jinbin DevelopmentLtd might be undervalued or overvalued with our detailed analysis, featuring fair value estimates, potential risks, dividends, insider trades, and its financial condition.
Access Free AnalysisHave feedback on this article? Concerned about the content? Get in touch with us directly. Alternatively, email editorial-team (at) simplywallst.com.
This article by Simply Wall St is general in nature. We provide commentary based on historical data and analyst forecasts only using an unbiased methodology and our articles are not intended to be financial advice. It does not constitute a recommendation to buy or sell any stock, and does not take account of your objectives, or your financial situation. We aim to bring you long-term focused analysis driven by fundamental data. Note that our analysis may not factor in the latest price-sensitive company announcements or qualitative material. Simply Wall St has no position in any stocks mentioned.
About SZSE:000897
Tianjin Jinbin DevelopmentLtd
Engages in the real estate development business in China.
Excellent balance sheet with low risk.
Market Insights

Advertisement
Community Narratives
MicroVision will explode future revenue by 380.37% with a vision towards success
Fair Value US$60.00|98.5% undervalued
TH
Community Contributor
The Indispensable Artery for a New North American Economy
Fair Value CA$132.87|2.3% undervalued
TI
Community Contributor