
Advertisement
- China
- /
- Real Estate
- /
- SHSE:600791
A Piece Of The Puzzle Missing From BEH-Property Co.,Ltd.'s (SHSE:600791) 30% Share Price Climb
The BEH-Property Co.,Ltd. (SHSE:600791) share price has done very well over the last month, posting an excellent gain of 30%. But the gains over the last month weren't enough to make shareholders whole, as the share price is still down 3.6% in the last twelve months.
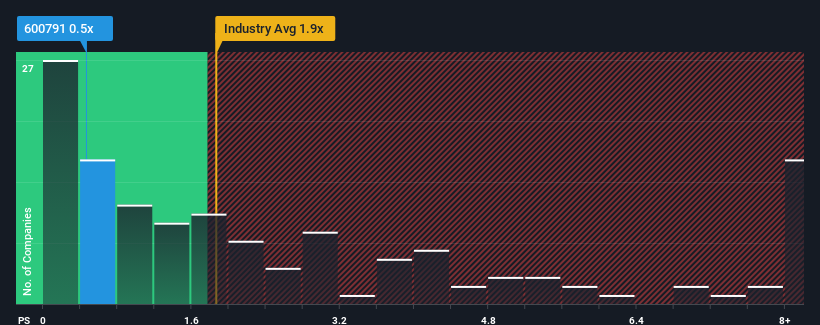
Even after such a large jump in price, BEH-PropertyLtd's price-to-sales (or "P/S") ratio of 0.5x might still make it look like a buy right now compared to the Real Estate industry in China, where around half of the companies have P/S ratios above 1.9x and even P/S above 5x are quite common. However, the P/S might be low for a reason and it requires further investigation to determine if it's justified.
Check out our latest analysis for BEH-PropertyLtd
How Has BEH-PropertyLtd Performed Recently?
For example, consider that BEH-PropertyLtd's financial performance has been poor lately as its revenue has been in decline. It might be that many expect the disappointing revenue performance to continue or accelerate, which has repressed the P/S. Those who are bullish on BEH-PropertyLtd will be hoping that this isn't the case so that they can pick up the stock at a lower valuation.
Although there are no analyst estimates available for BEH-PropertyLtd, take a look at this free data-rich visualisation to see how the company stacks up on earnings, revenue and cash flow.What Are Revenue Growth Metrics Telling Us About The Low P/S?
There's an inherent assumption that a company should underperform the industry for P/S ratios like BEH-PropertyLtd's to be considered reasonable.
Taking a look back first, the company's revenue growth last year wasn't something to get excited about as it posted a disappointing decline of 41%. Still, the latest three year period has seen an excellent 293% overall rise in revenue, in spite of its unsatisfying short-term performance. Accordingly, while they would have preferred to keep the run going, shareholders would definitely welcome the medium-term rates of revenue growth.
Comparing that to the industry, which is only predicted to deliver 11% growth in the next 12 months, the company's momentum is stronger based on recent medium-term annualised revenue results.
In light of this, it's peculiar that BEH-PropertyLtd's P/S sits below the majority of other companies. Apparently some shareholders believe the recent performance has exceeded its limits and have been accepting significantly lower selling prices.
The Bottom Line On BEH-PropertyLtd's P/S
Despite BEH-PropertyLtd's share price climbing recently, its P/S still lags most other companies. It's argued the price-to-sales ratio is an inferior measure of value within certain industries, but it can be a powerful business sentiment indicator.
We're very surprised to see BEH-PropertyLtd currently trading on a much lower than expected P/S since its recent three-year growth is higher than the wider industry forecast. When we see robust revenue growth that outpaces the industry, we presume that there are notable underlying risks to the company's future performance, which is exerting downward pressure on the P/S ratio. At least price risks look to be very low if recent medium-term revenue trends continue, but investors seem to think future revenue could see a lot of volatility.
It is also worth noting that we have found 2 warning signs for BEH-PropertyLtd that you need to take into consideration.
Of course, profitable companies with a history of great earnings growth are generally safer bets. So you may wish to see this free collection of other companies that have reasonable P/E ratios and have grown earnings strongly.
Valuation is complex, but we're here to simplify it.
Discover if BEH-PropertyLtd might be undervalued or overvalued with our detailed analysis, featuring fair value estimates, potential risks, dividends, insider trades, and its financial condition.
Access Free AnalysisHave feedback on this article? Concerned about the content? Get in touch with us directly. Alternatively, email editorial-team (at) simplywallst.com.
This article by Simply Wall St is general in nature. We provide commentary based on historical data and analyst forecasts only using an unbiased methodology and our articles are not intended to be financial advice. It does not constitute a recommendation to buy or sell any stock, and does not take account of your objectives, or your financial situation. We aim to bring you long-term focused analysis driven by fundamental data. Note that our analysis may not factor in the latest price-sensitive company announcements or qualitative material. Simply Wall St has no position in any stocks mentioned.
About SHSE:600791
BEH-PropertyLtd
Together with subsidiaries engages in the real estate development and management business in China.
Excellent balance sheet and slightly overvalued.
Market Insights

Advertisement
Community Narratives
The company that turned a verb into a global necessity and basically runs the modern internet, digital ads, smartphones, maps, and AI.
Fair Value US$300.00|5.2% undervalued
OS
Community Contributor
Flowers Foods Pays A Fair Price For Health
Fair Value US$16.12|24.9% undervalued
NV
Community Contributor
TMX Group will thrive with 33.3% profit margin and enduring market moat
Fair Value CA$49.90|3.3% overvalued
LI
Community Contributor
The "Molecular Pencil": Why Beam's Technology is Built to Win
Fair Value US$65.01|64.5% undervalued
DA
Community Contributor