- China
- /
- Real Estate
- /
- SHSE:600383
Gemdale (SHSE:600383) sheds CN¥632m, company earnings and investor returns have been trending downwards for past five years


Statistically speaking, long term investing is a profitable endeavour. But that doesn't mean long term investors can avoid big losses. For example the Gemdale Corporation (SHSE:600383) share price dropped 74% over five years. That's not a lot of fun for true believers. And we doubt long term believers are the only worried holders, since the stock price has declined 52% over the last twelve months. More recently, the share price has dropped a further 17% in a month.
With the stock having lost 4.1% in the past week, it's worth taking a look at business performance and seeing if there's any red flags.
View our latest analysis for Gemdale
In his essay The Superinvestors of Graham-and-Doddsville Warren Buffett described how share prices do not always rationally reflect the value of a business. One way to examine how market sentiment has changed over time is to look at the interaction between a company's share price and its earnings per share (EPS).
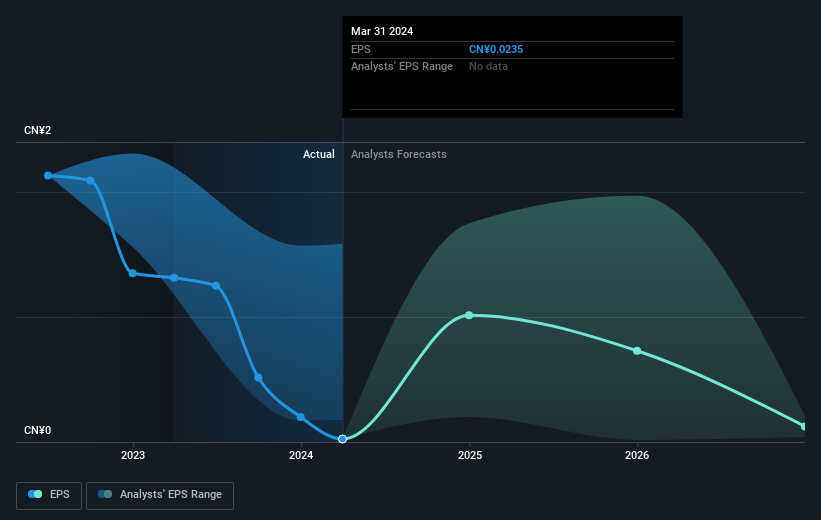
During the five years over which the share price declined, Gemdale's earnings per share (EPS) dropped by 59% each year. The share price decline of 23% per year isn't as bad as the EPS decline. The relatively muted share price reaction might be because the market expects the business to turn around. With a P/E ratio of 142.78, it's fair to say the market sees a brighter future for the business.
The graphic below depicts how EPS has changed over time (unveil the exact values by clicking on the image).
This free interactive report on Gemdale's earnings, revenue and cash flow is a great place to start, if you want to investigate the stock further.
What About Dividends?
When looking at investment returns, it is important to consider the difference between total shareholder return (TSR) and share price return. The TSR is a return calculation that accounts for the value of cash dividends (assuming that any dividend received was reinvested) and the calculated value of any discounted capital raisings and spin-offs. Arguably, the TSR gives a more comprehensive picture of the return generated by a stock. As it happens, Gemdale's TSR for the last 5 years was -68%, which exceeds the share price return mentioned earlier. This is largely a result of its dividend payments!
A Different Perspective
While the broader market lost about 17% in the twelve months, Gemdale shareholders did even worse, losing 51% (even including dividends). Having said that, it's inevitable that some stocks will be oversold in a falling market. The key is to keep your eyes on the fundamental developments. Unfortunately, last year's performance may indicate unresolved challenges, given that it was worse than the annualised loss of 11% over the last half decade. Generally speaking long term share price weakness can be a bad sign, though contrarian investors might want to research the stock in hope of a turnaround. While it is well worth considering the different impacts that market conditions can have on the share price, there are other factors that are even more important. For example, we've discovered 3 warning signs for Gemdale (1 is a bit unpleasant!) that you should be aware of before investing here.
If you would prefer to check out another company -- one with potentially superior financials -- then do not miss this free list of companies that have proven they can grow earnings.
Please note, the market returns quoted in this article reflect the market weighted average returns of stocks that currently trade on Chinese exchanges.
New: Manage All Your Stock Portfolios in One Place
We've created the ultimate portfolio companion for stock investors, and it's free.
• Connect an unlimited number of Portfolios and see your total in one currency
• Be alerted to new Warning Signs or Risks via email or mobile
• Track the Fair Value of your stocks
Have feedback on this article? Concerned about the content? Get in touch with us directly. Alternatively, email editorial-team (at) simplywallst.com.
This article by Simply Wall St is general in nature. We provide commentary based on historical data and analyst forecasts only using an unbiased methodology and our articles are not intended to be financial advice. It does not constitute a recommendation to buy or sell any stock, and does not take account of your objectives, or your financial situation. We aim to bring you long-term focused analysis driven by fundamental data. Note that our analysis may not factor in the latest price-sensitive company announcements or qualitative material. Simply Wall St has no position in any stocks mentioned.
Have feedback on this article? Concerned about the content? Get in touch with us directly. Alternatively, email editorial-team@simplywallst.com
About SHSE:600383
Gemdale
Engages in the real estate development business in China and internationally.
Adequate balance sheet low.
