Guiyang Xintian PharmaceuticalLtd (SZSE:002873) investors are up 22% in the past week, but earnings have declined over the last five years


When we invest, we're generally looking for stocks that outperform the market average. And in our experience, buying the right stocks can give your wealth a significant boost. For example, the Guiyang Xintian Pharmaceutical Co.,Ltd. (SZSE:002873) share price is up 40% in the last 5 years, clearly besting the market return of around 16% (ignoring dividends).
Since it's been a strong week for Guiyang Xintian PharmaceuticalLtd shareholders, let's have a look at trend of the longer term fundamentals.
See our latest analysis for Guiyang Xintian PharmaceuticalLtd
To paraphrase Benjamin Graham: Over the short term the market is a voting machine, but over the long term it's a weighing machine. One way to examine how market sentiment has changed over time is to look at the interaction between a company's share price and its earnings per share (EPS).
During five years of share price growth, Guiyang Xintian PharmaceuticalLtd actually saw its EPS drop 1.0% per year.
By glancing at these numbers, we'd posit that the decline in earnings per share is not representative of how the business has changed over the years. Since the change in EPS doesn't seem to correlate with the change in share price, it's worth taking a look at other metrics.
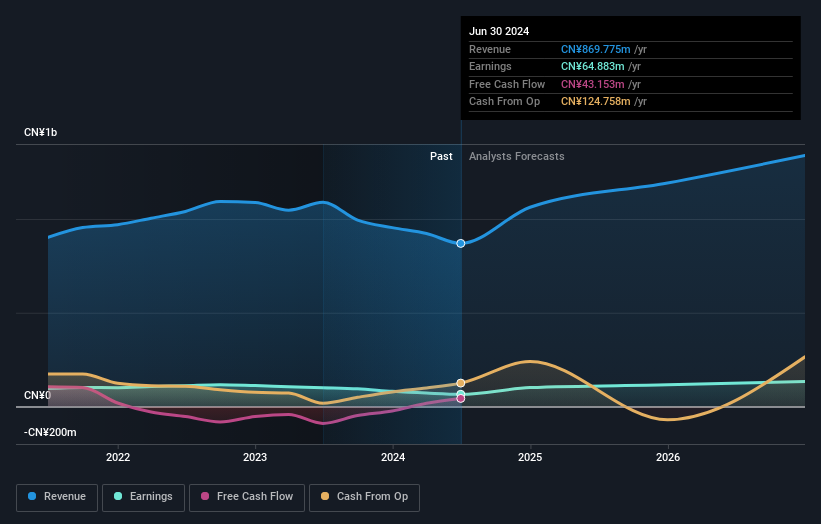
We doubt the modest 0.6% dividend yield is attracting many buyers to the stock. On the other hand, Guiyang Xintian PharmaceuticalLtd's revenue is growing nicely, at a compound rate of 7.1% over the last five years. It's quite possible that management are prioritizing revenue growth over EPS growth at the moment.
You can see how earnings and revenue have changed over time in the image below (click on the chart to see the exact values).
Take a more thorough look at Guiyang Xintian PharmaceuticalLtd's financial health with this free report on its balance sheet.
What About Dividends?
When looking at investment returns, it is important to consider the difference between total shareholder return (TSR) and share price return. The TSR incorporates the value of any spin-offs or discounted capital raisings, along with any dividends, based on the assumption that the dividends are reinvested. It's fair to say that the TSR gives a more complete picture for stocks that pay a dividend. In the case of Guiyang Xintian PharmaceuticalLtd, it has a TSR of 45% for the last 5 years. That exceeds its share price return that we previously mentioned. The dividends paid by the company have thusly boosted the total shareholder return.
A Different Perspective
Investors in Guiyang Xintian PharmaceuticalLtd had a tough year, with a total loss of 3.5% (including dividends), against a market gain of about 7.4%. However, keep in mind that even the best stocks will sometimes underperform the market over a twelve month period. Longer term investors wouldn't be so upset, since they would have made 8%, each year, over five years. It could be that the recent sell-off is an opportunity, so it may be worth checking the fundamental data for signs of a long term growth trend. It's always interesting to track share price performance over the longer term. But to understand Guiyang Xintian PharmaceuticalLtd better, we need to consider many other factors. For example, we've discovered 2 warning signs for Guiyang Xintian PharmaceuticalLtd (1 makes us a bit uncomfortable!) that you should be aware of before investing here.
If you are like me, then you will not want to miss this free list of undervalued small caps that insiders are buying.
Please note, the market returns quoted in this article reflect the market weighted average returns of stocks that currently trade on Chinese exchanges.
New: Manage All Your Stock Portfolios in One Place
We've created the ultimate portfolio companion for stock investors, and it's free.
• Connect an unlimited number of Portfolios and see your total in one currency
• Be alerted to new Warning Signs or Risks via email or mobile
• Track the Fair Value of your stocks
Have feedback on this article? Concerned about the content? Get in touch with us directly. Alternatively, email editorial-team (at) simplywallst.com.
This article by Simply Wall St is general in nature. We provide commentary based on historical data and analyst forecasts only using an unbiased methodology and our articles are not intended to be financial advice. It does not constitute a recommendation to buy or sell any stock, and does not take account of your objectives, or your financial situation. We aim to bring you long-term focused analysis driven by fundamental data. Note that our analysis may not factor in the latest price-sensitive company announcements or qualitative material. Simply Wall St has no position in any stocks mentioned.
About SZSE:002873
Guiyang Xintian PharmaceuticalLtd
Engages in the research and development, production, and sale of new Chinese patent medicines for various diseases in China.
Moderate growth potential second-rate dividend payer.
