Stock Analysis
Despite lower earnings than three years ago, KPC PharmaceuticalsInc (SHSE:600422) investors are up 155% since then


The worst result, after buying shares in a company (assuming no leverage), would be if you lose all the money you put in. But in contrast you can make much more than 100% if the company does well. For instance the KPC Pharmaceuticals,Inc (SHSE:600422) share price is 141% higher than it was three years ago. Most would be happy with that. It's also good to see the share price up 12% over the last quarter. But this could be related to the strong market, which is up 11% in the last three months.
While this past week has detracted from the company's three-year return, let's look at the recent trends of the underlying business and see if the gains have been in alignment.
View our latest analysis for KPC PharmaceuticalsInc
There is no denying that markets are sometimes efficient, but prices do not always reflect underlying business performance. One imperfect but simple way to consider how the market perception of a company has shifted is to compare the change in the earnings per share (EPS) with the share price movement.
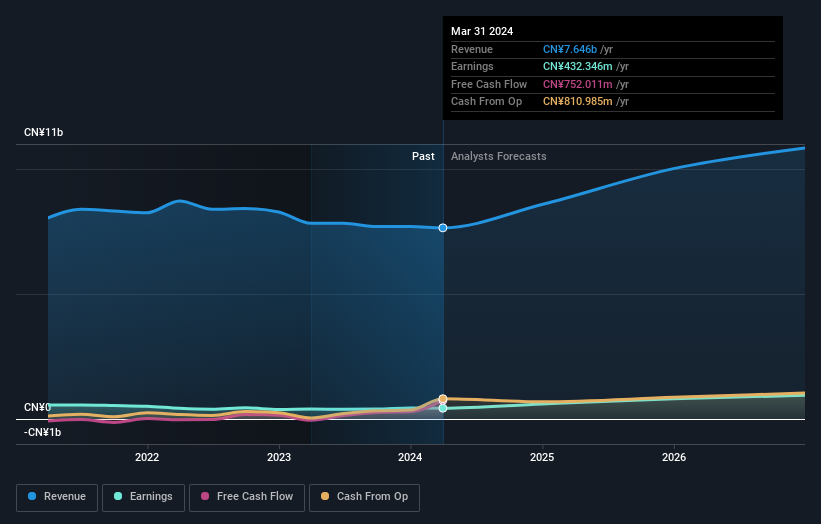
Over the last three years, KPC PharmaceuticalsInc failed to grow earnings per share, which fell 8.2% (annualized).
This means it's unlikely the market is judging the company based on earnings growth. Given this situation, it makes sense to look at other metrics too.
The modest 0.9% dividend yield is unlikely to be propping up the share price. You can only imagine how long term shareholders feel about the declining revenue trend (slipping at 3.1% per year). The only thing that's clear is there is low correlation between KPC PharmaceuticalsInc's share price and its historic fundamental data. Further research may be required!
The graphic below depicts how earnings and revenue have changed over time (unveil the exact values by clicking on the image).
You can see how its balance sheet has strengthened (or weakened) over time in this free interactive graphic.
What About Dividends?
When looking at investment returns, it is important to consider the difference between total shareholder return (TSR) and share price return. Whereas the share price return only reflects the change in the share price, the TSR includes the value of dividends (assuming they were reinvested) and the benefit of any discounted capital raising or spin-off. Arguably, the TSR gives a more comprehensive picture of the return generated by a stock. As it happens, KPC PharmaceuticalsInc's TSR for the last 3 years was 155%, which exceeds the share price return mentioned earlier. This is largely a result of its dividend payments!
A Different Perspective
It's good to see that KPC PharmaceuticalsInc has rewarded shareholders with a total shareholder return of 8.5% in the last twelve months. And that does include the dividend. However, that falls short of the 19% TSR per annum it has made for shareholders, each year, over five years. The pessimistic view would be that be that the stock has its best days behind it, but on the other hand the price might simply be moderating while the business itself continues to execute. I find it very interesting to look at share price over the long term as a proxy for business performance. But to truly gain insight, we need to consider other information, too. Consider for instance, the ever-present spectre of investment risk. We've identified 1 warning sign with KPC PharmaceuticalsInc , and understanding them should be part of your investment process.
If you like to buy stocks alongside management, then you might just love this free list of companies. (Hint: insiders have been buying them).
Please note, the market returns quoted in this article reflect the market weighted average returns of stocks that currently trade on Chinese exchanges.
Valuation is complex, but we're helping make it simple.
Find out whether KPC PharmaceuticalsInc is potentially over or undervalued by checking out our comprehensive analysis, which includes fair value estimates, risks and warnings, dividends, insider transactions and financial health.
View the Free AnalysisHave feedback on this article? Concerned about the content? Get in touch with us directly. Alternatively, email editorial-team (at) simplywallst.com.
This article by Simply Wall St is general in nature. We provide commentary based on historical data and analyst forecasts only using an unbiased methodology and our articles are not intended to be financial advice. It does not constitute a recommendation to buy or sell any stock, and does not take account of your objectives, or your financial situation. We aim to bring you long-term focused analysis driven by fundamental data. Note that our analysis may not factor in the latest price-sensitive company announcements or qualitative material. Simply Wall St has no position in any stocks mentioned.
About SHSE:600422
KPC PharmaceuticalsInc
KPC Pharmaceuticals, Inc, a pharmaceutical company, engages in the research and development, production, marketing, and commercial wholesale of botanical drugs in the People’s Republic of China and internationally.
Flawless balance sheet with proven track record and pays a dividend.
