The three-year underlying earnings growth at Joincare Pharmaceutical Group IndustryLtd (SHSE:600380) is promising, but the shareholders are still in the red over that time


Investors are understandably disappointed when a stock they own declines in value. But no-one can make money on every call, especially in a declining market. While the Joincare Pharmaceutical Group Industry Co.,Ltd. (SHSE:600380) share price is down 23% in the last three years, the total return to shareholders (which includes dividends) was -19%. And that total return actually beats the market decline of 33%. The share price has dropped 23% in three months. However, one could argue that the price has been influenced by the general market, which is down 13% in the same timeframe.
Since Joincare Pharmaceutical Group IndustryLtd has shed CN¥675m from its value in the past 7 days, let's see if the longer term decline has been driven by the business' economics.
View our latest analysis for Joincare Pharmaceutical Group IndustryLtd
There is no denying that markets are sometimes efficient, but prices do not always reflect underlying business performance. One flawed but reasonable way to assess how sentiment around a company has changed is to compare the earnings per share (EPS) with the share price.
Although the share price is down over three years, Joincare Pharmaceutical Group IndustryLtd actually managed to grow EPS by 9.0% per year in that time. Given the share price reaction, one might suspect that EPS is not a good guide to the business performance during the period (perhaps due to a one-off loss or gain). Or else the company was over-hyped in the past, and so its growth has disappointed.
It's worth taking a look at other metrics, because the EPS growth doesn't seem to match with the falling share price.
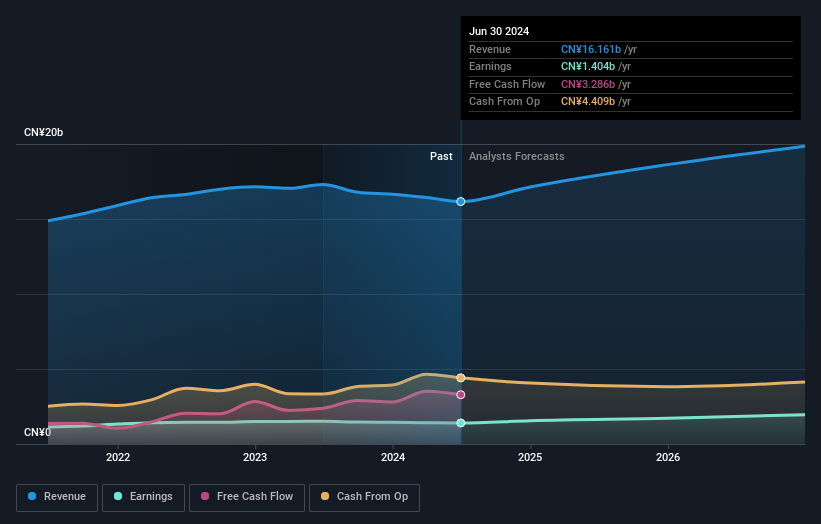
With a rather small yield of just 1.9% we doubt that the stock's share price is based on its dividend. The company has kept revenue pretty healthy over the last three years, so we doubt that explains the falling share price. There doesn't seem to be any clear correlation between the fundamental business metrics and the share price. That could mean that the stock was previously overrated, or it could spell opportunity now.
You can see how earnings and revenue have changed over time in the image below (click on the chart to see the exact values).
You can see how its balance sheet has strengthened (or weakened) over time in this free interactive graphic.
What About Dividends?
It is important to consider the total shareholder return, as well as the share price return, for any given stock. The TSR is a return calculation that accounts for the value of cash dividends (assuming that any dividend received was reinvested) and the calculated value of any discounted capital raisings and spin-offs. Arguably, the TSR gives a more comprehensive picture of the return generated by a stock. In the case of Joincare Pharmaceutical Group IndustryLtd, it has a TSR of -19% for the last 3 years. That exceeds its share price return that we previously mentioned. And there's no prize for guessing that the dividend payments largely explain the divergence!
A Different Perspective
The total return of 19% received by Joincare Pharmaceutical Group IndustryLtd shareholders over the last year isn't far from the market return of -19%. So last year was actually even worse than the last five years, which cost shareholders 0.2% per year. Weak performance over the long term usually destroys market confidence in a stock, but bargain hunters may want to take a closer look for signs of a turnaround. Before deciding if you like the current share price, check how Joincare Pharmaceutical Group IndustryLtd scores on these 3 valuation metrics.
We will like Joincare Pharmaceutical Group IndustryLtd better if we see some big insider buys. While we wait, check out this free list of undervalued stocks (mostly small caps) with considerable, recent, insider buying.
Please note, the market returns quoted in this article reflect the market weighted average returns of stocks that currently trade on Chinese exchanges.
New: Manage All Your Stock Portfolios in One Place
We've created the ultimate portfolio companion for stock investors, and it's free.
• Connect an unlimited number of Portfolios and see your total in one currency
• Be alerted to new Warning Signs or Risks via email or mobile
• Track the Fair Value of your stocks
Have feedback on this article? Concerned about the content? Get in touch with us directly. Alternatively, email editorial-team (at) simplywallst.com.
This article by Simply Wall St is general in nature. We provide commentary based on historical data and analyst forecasts only using an unbiased methodology and our articles are not intended to be financial advice. It does not constitute a recommendation to buy or sell any stock, and does not take account of your objectives, or your financial situation. We aim to bring you long-term focused analysis driven by fundamental data. Note that our analysis may not factor in the latest price-sensitive company announcements or qualitative material. Simply Wall St has no position in any stocks mentioned.
About SHSE:600380
Joincare Pharmaceutical Group IndustryLtd
Joincare Pharmaceutical Group Industry Co.,Ltd.
Undervalued with excellent balance sheet and pays a dividend.
