Henan Lingrui Pharmaceutical's (SHSE:600285) five-year earnings growth trails the 27% YoY shareholder returns


It hasn't been the best quarter for Henan Lingrui Pharmaceutical Co., Ltd. (SHSE:600285) shareholders, since the share price has fallen 12% in that time. But that doesn't change the fact that the returns over the last five years have been very strong. It's fair to say most would be happy with 176% the gain in that time. Generally speaking the long term returns will give you a better idea of business quality than short periods can. Ultimately business performance will determine whether the stock price continues the positive long term trend.
Since the stock has added CN¥2.0b to its market cap in the past week alone, let's see if underlying performance has been driving long-term returns.
See our latest analysis for Henan Lingrui Pharmaceutical
While markets are a powerful pricing mechanism, share prices reflect investor sentiment, not just underlying business performance. One imperfect but simple way to consider how the market perception of a company has shifted is to compare the change in the earnings per share (EPS) with the share price movement.
Over half a decade, Henan Lingrui Pharmaceutical managed to grow its earnings per share at 20% a year. So the EPS growth rate is rather close to the annualized share price gain of 22% per year. This indicates that investor sentiment towards the company has not changed a great deal. In fact, the share price seems to largely reflect the EPS growth.
The company's earnings per share (over time) is depicted in the image below (click to see the exact numbers).
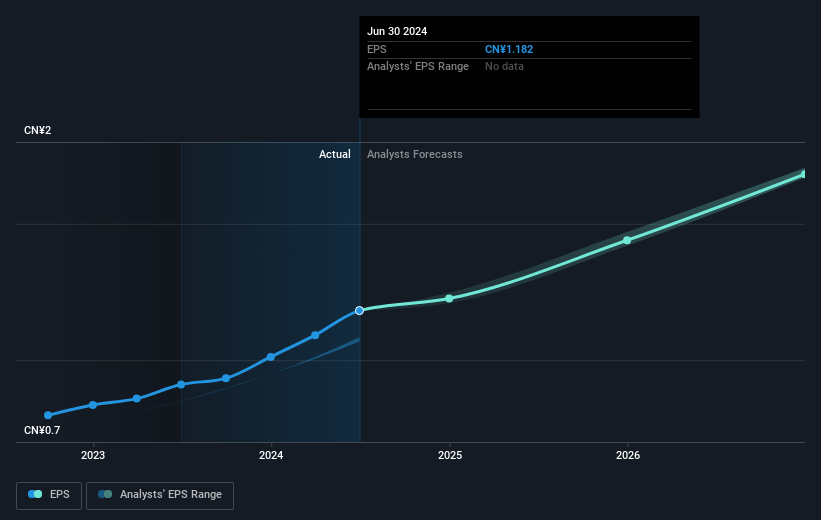
We know that Henan Lingrui Pharmaceutical has improved its bottom line lately, but is it going to grow revenue? Check if analysts think Henan Lingrui Pharmaceutical will grow revenue in the future.
What About Dividends?
When looking at investment returns, it is important to consider the difference between total shareholder return (TSR) and share price return. The TSR is a return calculation that accounts for the value of cash dividends (assuming that any dividend received was reinvested) and the calculated value of any discounted capital raisings and spin-offs. So for companies that pay a generous dividend, the TSR is often a lot higher than the share price return. We note that for Henan Lingrui Pharmaceutical the TSR over the last 5 years was 231%, which is better than the share price return mentioned above. This is largely a result of its dividend payments!
A Different Perspective
It's nice to see that Henan Lingrui Pharmaceutical shareholders have received a total shareholder return of 31% over the last year. And that does include the dividend. That gain is better than the annual TSR over five years, which is 27%. Therefore it seems like sentiment around the company has been positive lately. Given the share price momentum remains strong, it might be worth taking a closer look at the stock, lest you miss an opportunity. I find it very interesting to look at share price over the long term as a proxy for business performance. But to truly gain insight, we need to consider other information, too. For instance, we've identified 1 warning sign for Henan Lingrui Pharmaceutical that you should be aware of.
If you are like me, then you will not want to miss this free list of undervalued small caps that insiders are buying.
Please note, the market returns quoted in this article reflect the market weighted average returns of stocks that currently trade on Chinese exchanges.
Valuation is complex, but we're here to simplify it.
Discover if Henan Lingrui Pharmaceutical might be undervalued or overvalued with our detailed analysis, featuring fair value estimates, potential risks, dividends, insider trades, and its financial condition.
Access Free AnalysisHave feedback on this article? Concerned about the content? Get in touch with us directly. Alternatively, email editorial-team (at) simplywallst.com.
This article by Simply Wall St is general in nature. We provide commentary based on historical data and analyst forecasts only using an unbiased methodology and our articles are not intended to be financial advice. It does not constitute a recommendation to buy or sell any stock, and does not take account of your objectives, or your financial situation. We aim to bring you long-term focused analysis driven by fundamental data. Note that our analysis may not factor in the latest price-sensitive company announcements or qualitative material. Simply Wall St has no position in any stocks mentioned.
About SHSE:600285
Outstanding track record with flawless balance sheet and pays a dividend.

