
Advertisement
The external fund manager backed by Berkshire Hathaway's Charlie Munger, Li Lu, makes no bones about it when he says 'The biggest investment risk is not the volatility of prices, but whether you will suffer a permanent loss of capital.' So it might be obvious that you need to consider debt, when you think about how risky any given stock is, because too much debt can sink a company. Importantly, YOOZOO Interactive Co., Ltd. (SZSE:002174) does carry debt. But the real question is whether this debt is making the company risky.
What Risk Does Debt Bring?
Debt is a tool to help businesses grow, but if a business is incapable of paying off its lenders, then it exists at their mercy. Ultimately, if the company can't fulfill its legal obligations to repay debt, shareholders could walk away with nothing. However, a more usual (but still expensive) situation is where a company must dilute shareholders at a cheap share price simply to get debt under control. Having said that, the most common situation is where a company manages its debt reasonably well - and to its own advantage. When we think about a company's use of debt, we first look at cash and debt together.
View our latest analysis for YOOZOO Interactive
What Is YOOZOO Interactive's Debt?
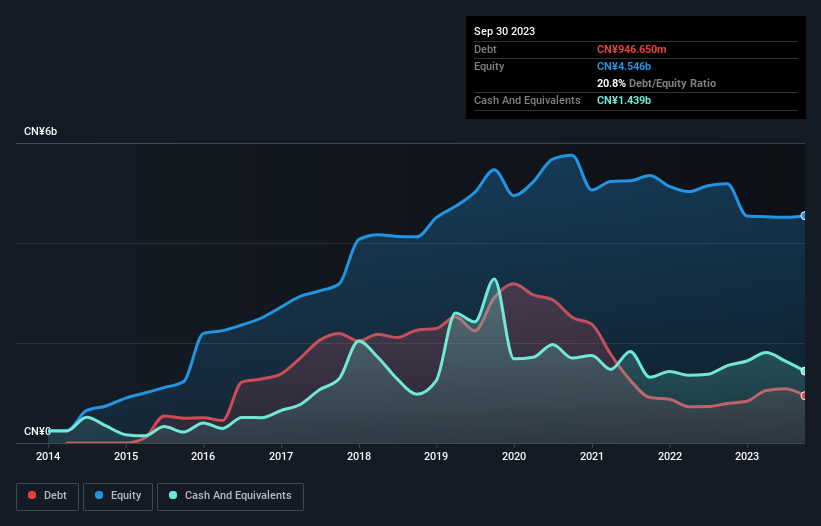
The image below, which you can click on for greater detail, shows that at September 2023 YOOZOO Interactive had debt of CN¥946.6m, up from CN¥791.5m in one year. But it also has CN¥1.44b in cash to offset that, meaning it has CN¥491.9m net cash.
A Look At YOOZOO Interactive's Liabilities
The latest balance sheet data shows that YOOZOO Interactive had liabilities of CN¥769.6m due within a year, and liabilities of CN¥706.1m falling due after that. On the other hand, it had cash of CN¥1.44b and CN¥332.8m worth of receivables due within a year. So it actually has CN¥295.7m more liquid assets than total liabilities.
This surplus suggests that YOOZOO Interactive has a conservative balance sheet, and could probably eliminate its debt without much difficulty. Simply put, the fact that YOOZOO Interactive has more cash than debt is arguably a good indication that it can manage its debt safely. When analysing debt levels, the balance sheet is the obvious place to start. But ultimately the future profitability of the business will decide if YOOZOO Interactive can strengthen its balance sheet over time. So if you're focused on the future you can check out this free report showing analyst profit forecasts.
In the last year YOOZOO Interactive had a loss before interest and tax, and actually shrunk its revenue by 21%, to CN¥1.7b. To be frank that doesn't bode well.
So How Risky Is YOOZOO Interactive?
We have no doubt that loss making companies are, in general, riskier than profitable ones. And the fact is that over the last twelve months YOOZOO Interactive lost money at the earnings before interest and tax (EBIT) line. And over the same period it saw negative free cash outflow of CN¥436m and booked a CN¥698m accounting loss. While this does make the company a bit risky, it's important to remember it has net cash of CN¥491.9m. That kitty means the company can keep spending for growth for at least two years, at current rates. Overall, its balance sheet doesn't seem overly risky, at the moment, but we're always cautious until we see the positive free cash flow. The balance sheet is clearly the area to focus on when you are analysing debt. But ultimately, every company can contain risks that exist outside of the balance sheet. For example - YOOZOO Interactive has 1 warning sign we think you should be aware of.
When all is said and done, sometimes its easier to focus on companies that don't even need debt. Readers can access a list of growth stocks with zero net debt 100% free, right now.
New: Manage All Your Stock Portfolios in One Place
We've created the ultimate portfolio companion for stock investors, and it's free.
• Connect an unlimited number of Portfolios and see your total in one currency
• Be alerted to new Warning Signs or Risks via email or mobile
• Track the Fair Value of your stocks
Have feedback on this article? Concerned about the content? Get in touch with us directly. Alternatively, email editorial-team (at) simplywallst.com.
This article by Simply Wall St is general in nature. We provide commentary based on historical data and analyst forecasts only using an unbiased methodology and our articles are not intended to be financial advice. It does not constitute a recommendation to buy or sell any stock, and does not take account of your objectives, or your financial situation. We aim to bring you long-term focused analysis driven by fundamental data. Note that our analysis may not factor in the latest price-sensitive company announcements or qualitative material. Simply Wall St has no position in any stocks mentioned.
About SZSE:002174
YOOZOO Interactive
Engages in the research and development, and distribution of mobile and web games.
Adequate balance sheet with moderate growth potential.
Similar Companies
Market Insights

Advertisement
Community Narratives
The company that turned a verb into a global necessity and basically runs the modern internet, digital ads, smartphones, maps, and AI.
Fair Value US$300.00|6.3% undervalued
OS
Community Contributor
Flowers Foods Pays A Fair Price For Health
Fair Value US$16.12|26.0% undervalued
NV
Community Contributor
TMX Group will thrive with 33.3% profit margin and enduring market moat
Fair Value CA$49.90|3.7% overvalued
LI
Community Contributor