
Advertisement
- China
- /
- Basic Materials
- /
- SZSE:300737
Not Many Are Piling Into Keshun Waterproof Technolgies Co.,Ltd. (SZSE:300737) Stock Yet As It Plummets 26%
To the annoyance of some shareholders, Keshun Waterproof Technolgies Co.,Ltd. (SZSE:300737) shares are down a considerable 26% in the last month, which continues a horrid run for the company. For any long-term shareholders, the last month ends a year to forget by locking in a 68% share price decline.
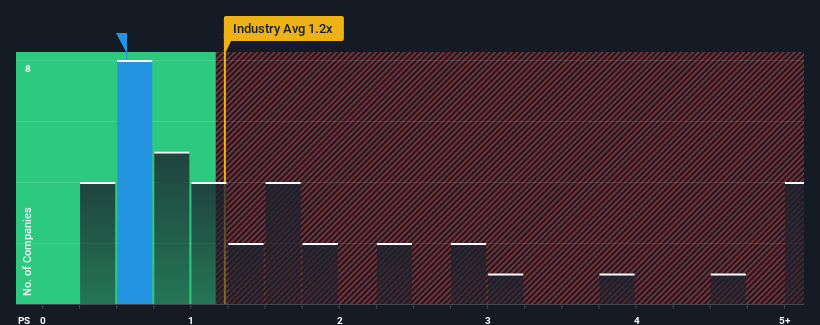
Following the heavy fall in price, given about half the companies operating in China's Basic Materials industry have price-to-sales ratios (or "P/S") above 1.2x, you may consider Keshun Waterproof TechnolgiesLtd as an attractive investment with its 0.6x P/S ratio. Although, it's not wise to just take the P/S at face value as there may be an explanation why it's limited.
View our latest analysis for Keshun Waterproof TechnolgiesLtd
How Has Keshun Waterproof TechnolgiesLtd Performed Recently?
Keshun Waterproof TechnolgiesLtd has been doing a reasonable job lately as its revenue hasn't declined as much as most other companies. Perhaps the market is expecting future revenue performance to dive, which has kept the P/S suppressed. So while you could say the stock is cheap, investors will be looking for improvement before they see it as good value. But at the very least, you'd be hoping that revenue doesn't fall off a cliff completely if your plan is to pick up some stock while it's out of favour.
Keen to find out how analysts think Keshun Waterproof TechnolgiesLtd's future stacks up against the industry? In that case, our free report is a great place to start.What Are Revenue Growth Metrics Telling Us About The Low P/S?
Keshun Waterproof TechnolgiesLtd's P/S ratio would be typical for a company that's only expected to deliver limited growth, and importantly, perform worse than the industry.
Taking a look back first, the company's revenue growth last year wasn't something to get excited about as it posted a disappointing decline of 1.2%. Even so, admirably revenue has lifted 40% in aggregate from three years ago, notwithstanding the last 12 months. So we can start by confirming that the company has generally done a very good job of growing revenue over that time, even though it had some hiccups along the way.
Turning to the outlook, the next year should generate growth of 20% as estimated by the eight analysts watching the company. That's shaping up to be materially higher than the 6.9% growth forecast for the broader industry.
With this in consideration, we find it intriguing that Keshun Waterproof TechnolgiesLtd's P/S sits behind most of its industry peers. Apparently some shareholders are doubtful of the forecasts and have been accepting significantly lower selling prices.
What We Can Learn From Keshun Waterproof TechnolgiesLtd's P/S?
Keshun Waterproof TechnolgiesLtd's recently weak share price has pulled its P/S back below other Basic Materials companies. It's argued the price-to-sales ratio is an inferior measure of value within certain industries, but it can be a powerful business sentiment indicator.
A look at Keshun Waterproof TechnolgiesLtd's revenues reveals that, despite glowing future growth forecasts, its P/S is much lower than we'd expect. When we see strong growth forecasts like this, we can only assume potential risks are what might be placing significant pressure on the P/S ratio. At least price risks look to be very low, but investors seem to think future revenues could see a lot of volatility.
Before you take the next step, you should know about the 1 warning sign for Keshun Waterproof TechnolgiesLtd that we have uncovered.
If you're unsure about the strength of Keshun Waterproof TechnolgiesLtd's business, why not explore our interactive list of stocks with solid business fundamentals for some other companies you may have missed.
Valuation is complex, but we're here to simplify it.
Discover if Keshun Waterproof TechnolgiesLtd might be undervalued or overvalued with our detailed analysis, featuring fair value estimates, potential risks, dividends, insider trades, and its financial condition.
Access Free AnalysisHave feedback on this article? Concerned about the content? Get in touch with us directly. Alternatively, email editorial-team (at) simplywallst.com.
This article by Simply Wall St is general in nature. We provide commentary based on historical data and analyst forecasts only using an unbiased methodology and our articles are not intended to be financial advice. It does not constitute a recommendation to buy or sell any stock, and does not take account of your objectives, or your financial situation. We aim to bring you long-term focused analysis driven by fundamental data. Note that our analysis may not factor in the latest price-sensitive company announcements or qualitative material. Simply Wall St has no position in any stocks mentioned.
About SZSE:300737
Keshun Waterproof TechnolgiesLtd
Keshun Waterproof Technology Co.,Ltd. engages in the research and development, production, and sale of new building waterproof materials.
Fair value with moderate growth potential.
Market Insights

Advertisement
Community Narratives
The company that turned a verb into a global necessity and basically runs the modern internet, digital ads, smartphones, maps, and AI.
Fair Value US$300.00|7.5% undervalued
OS
Community Contributor
Flowers Foods Pays A Fair Price For Health
Fair Value US$16.12|25.4% undervalued
NV
Community Contributor
TMX Group will thrive with 33.3% profit margin and enduring market moat
Fair Value CA$49.90|3.6% overvalued
LI
Community Contributor
The "Molecular Pencil": Why Beam's Technology is Built to Win
Fair Value US$65.01|65.0% undervalued
DA
Community Contributor