
Advertisement
Estimating The Fair Value Of Weihai Guangwei Composites Co., Ltd. (SZSE:300699)
Key Insights
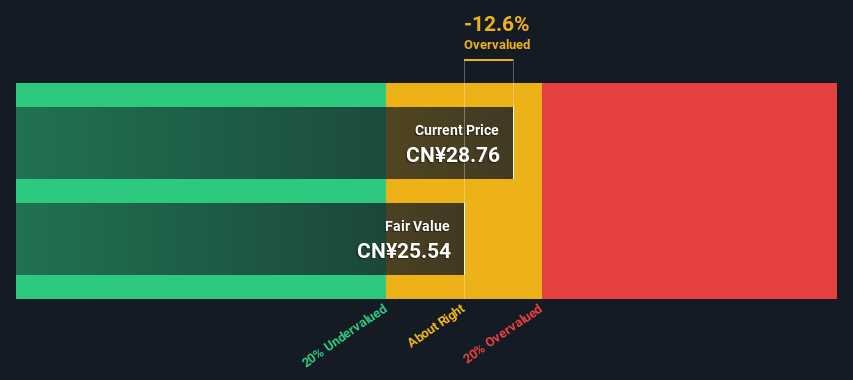
- Weihai Guangwei Composites' estimated fair value is CN¥25.54 based on 2 Stage Free Cash Flow to Equity
- Current share price of CN¥28.76 suggests Weihai Guangwei Composites is potentially trading close to its fair value
- Our fair value estimate is 21% lower than Weihai Guangwei Composites' analyst price target of CN¥32.44
How far off is Weihai Guangwei Composites Co., Ltd. (SZSE:300699) from its intrinsic value? Using the most recent financial data, we'll take a look at whether the stock is fairly priced by taking the expected future cash flows and discounting them to their present value. We will take advantage of the Discounted Cash Flow (DCF) model for this purpose. Don't get put off by the jargon, the math behind it is actually quite straightforward.
Companies can be valued in a lot of ways, so we would point out that a DCF is not perfect for every situation. If you still have some burning questions about this type of valuation, take a look at the Simply Wall St analysis model.
See our latest analysis for Weihai Guangwei Composites
The Method
We're using the 2-stage growth model, which simply means we take in account two stages of company's growth. In the initial period the company may have a higher growth rate and the second stage is usually assumed to have a stable growth rate. To start off with, we need to estimate the next ten years of cash flows. Where possible we use analyst estimates, but when these aren't available we extrapolate the previous free cash flow (FCF) from the last estimate or reported value. We assume companies with shrinking free cash flow will slow their rate of shrinkage, and that companies with growing free cash flow will see their growth rate slow, over this period. We do this to reflect that growth tends to slow more in the early years than it does in later years.
Generally we assume that a dollar today is more valuable than a dollar in the future, so we discount the value of these future cash flows to their estimated value in today's dollars:
10-year free cash flow (FCF) estimate
| 2024 | 2025 | 2026 | 2027 | 2028 | 2029 | 2030 | 2031 | 2032 | 2033 | |
| Levered FCF (CN¥, Millions) | CN¥85.0m | CN¥286.0m | CN¥471.7m | CN¥690.3m | CN¥920.3m | CN¥1.14b | CN¥1.35b | CN¥1.53b | CN¥1.68b | CN¥1.82b |
| Growth Rate Estimate Source | Analyst x1 | Analyst x1 | Est @ 64.94% | Est @ 46.34% | Est @ 33.32% | Est @ 24.20% | Est @ 17.83% | Est @ 13.36% | Est @ 10.23% | Est @ 8.05% |
| Present Value (CN¥, Millions) Discounted @ 8.4% | CN¥78.4 | CN¥244 | CN¥371 | CN¥501 | CN¥616 | CN¥706 | CN¥768 | CN¥804 | CN¥818 | CN¥815 |
("Est" = FCF growth rate estimated by Simply Wall St)
Present Value of 10-year Cash Flow (PVCF) = CN¥5.7b
The second stage is also known as Terminal Value, this is the business's cash flow after the first stage. For a number of reasons a very conservative growth rate is used that cannot exceed that of a country's GDP growth. In this case we have used the 5-year average of the 10-year government bond yield (2.9%) to estimate future growth. In the same way as with the 10-year 'growth' period, we discount future cash flows to today's value, using a cost of equity of 8.4%.
Terminal Value (TV)= FCF2033 × (1 + g) ÷ (r – g) = CN¥1.8b× (1 + 2.9%) ÷ (8.4%– 2.9%) = CN¥35b
Present Value of Terminal Value (PVTV)= TV / (1 + r)10= CN¥35b÷ ( 1 + 8.4%)10= CN¥16b
The total value, or equity value, is then the sum of the present value of the future cash flows, which in this case is CN¥21b. In the final step we divide the equity value by the number of shares outstanding. Compared to the current share price of CN¥28.8, the company appears around fair value at the time of writing. The assumptions in any calculation have a big impact on the valuation, so it is better to view this as a rough estimate, not precise down to the last cent.
The Assumptions
Now the most important inputs to a discounted cash flow are the discount rate, and of course, the actual cash flows. Part of investing is coming up with your own evaluation of a company's future performance, so try the calculation yourself and check your own assumptions. The DCF also does not consider the possible cyclicality of an industry, or a company's future capital requirements, so it does not give a full picture of a company's potential performance. Given that we are looking at Weihai Guangwei Composites as potential shareholders, the cost of equity is used as the discount rate, rather than the cost of capital (or weighted average cost of capital, WACC) which accounts for debt. In this calculation we've used 8.4%, which is based on a levered beta of 0.961. Beta is a measure of a stock's volatility, compared to the market as a whole. We get our beta from the industry average beta of globally comparable companies, with an imposed limit between 0.8 and 2.0, which is a reasonable range for a stable business.
SWOT Analysis for Weihai Guangwei Composites
Strength
- Debt is not viewed as a risk.
Weakness
- Earnings declined over the past year.
- Dividend is low compared to the top 25% of dividend payers in the Chemicals market.
- Expensive based on P/E ratio and estimated fair value.
Opportunity
- Annual revenue is forecast to grow faster than the Chinese market.
Threat
- Paying a dividend but company has no free cash flows.
- Annual earnings are forecast to grow slower than the Chinese market.
Looking Ahead:
Valuation is only one side of the coin in terms of building your investment thesis, and it ideally won't be the sole piece of analysis you scrutinize for a company. It's not possible to obtain a foolproof valuation with a DCF model. Rather it should be seen as a guide to "what assumptions need to be true for this stock to be under/overvalued?" If a company grows at a different rate, or if its cost of equity or risk free rate changes sharply, the output can look very different. For Weihai Guangwei Composites, there are three essential factors you should assess:
- Risks: Take risks, for example - Weihai Guangwei Composites has 1 warning sign we think you should be aware of.
- Future Earnings: How does 300699's growth rate compare to its peers and the wider market? Dig deeper into the analyst consensus number for the upcoming years by interacting with our free analyst growth expectation chart.
- Other High Quality Alternatives: Do you like a good all-rounder? Explore our interactive list of high quality stocks to get an idea of what else is out there you may be missing!
PS. Simply Wall St updates its DCF calculation for every Chinese stock every day, so if you want to find the intrinsic value of any other stock just search here.
Valuation is complex, but we're here to simplify it.
Discover if Weihai Guangwei Composites might be undervalued or overvalued with our detailed analysis, featuring fair value estimates, potential risks, dividends, insider trades, and its financial condition.
Access Free AnalysisHave feedback on this article? Concerned about the content? Get in touch with us directly. Alternatively, email editorial-team (at) simplywallst.com.
This article by Simply Wall St is general in nature. We provide commentary based on historical data and analyst forecasts only using an unbiased methodology and our articles are not intended to be financial advice. It does not constitute a recommendation to buy or sell any stock, and does not take account of your objectives, or your financial situation. We aim to bring you long-term focused analysis driven by fundamental data. Note that our analysis may not factor in the latest price-sensitive company announcements or qualitative material. Simply Wall St has no position in any stocks mentioned.
About SZSE:300699
Weihai Guangwei Composites
Researches, develops, produces, and sells high-performance carbon fiber and composite materials in China.
Excellent balance sheet with reasonable growth potential.
Market Insights

Advertisement
Community Narratives
The company that turned a verb into a global necessity and basically runs the modern internet, digital ads, smartphones, maps, and AI.
Fair Value US$300.00|6.3% undervalued
OS
Community Contributor
Flowers Foods Pays A Fair Price For Health
Fair Value US$16.12|26.0% undervalued
NV
Community Contributor
TMX Group will thrive with 33.3% profit margin and enduring market moat
Fair Value CA$49.90|3.7% overvalued
LI
Community Contributor