
Advertisement
Capital Allocation Trends At Hubei Forbon TechnologyLtd (SZSE:300387) Aren't Ideal
If we want to find a stock that could multiply over the long term, what are the underlying trends we should look for? Firstly, we'll want to see a proven return on capital employed (ROCE) that is increasing, and secondly, an expanding base of capital employed. Put simply, these types of businesses are compounding machines, meaning they are continually reinvesting their earnings at ever-higher rates of return. Having said that, from a first glance at Hubei Forbon TechnologyLtd (SZSE:300387) we aren't jumping out of our chairs at how returns are trending, but let's have a deeper look.
What Is Return On Capital Employed (ROCE)?
For those who don't know, ROCE is a measure of a company's yearly pre-tax profit (its return), relative to the capital employed in the business. Analysts use this formula to calculate it for Hubei Forbon TechnologyLtd:
Return on Capital Employed = Earnings Before Interest and Tax (EBIT) ÷ (Total Assets - Current Liabilities)
0.06 = CN¥97m ÷ (CN¥1.9b - CN¥272m) (Based on the trailing twelve months to September 2023).
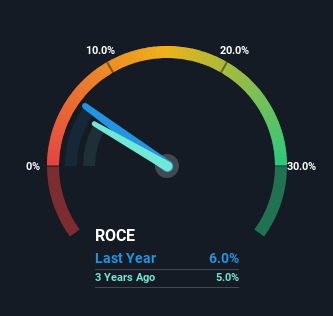
Therefore, Hubei Forbon TechnologyLtd has an ROCE of 6.0%. Even though it's in line with the industry average of 6.0%, it's still a low return by itself.
Check out our latest analysis for Hubei Forbon TechnologyLtd
While the past is not representative of the future, it can be helpful to know how a company has performed historically, which is why we have this chart above. If you're interested in investigating Hubei Forbon TechnologyLtd's past further, check out this free graph covering Hubei Forbon TechnologyLtd's past earnings, revenue and cash flow.
What Can We Tell From Hubei Forbon TechnologyLtd's ROCE Trend?
On the surface, the trend of ROCE at Hubei Forbon TechnologyLtd doesn't inspire confidence. To be more specific, ROCE has fallen from 7.8% over the last five years. Although, given both revenue and the amount of assets employed in the business have increased, it could suggest the company is investing in growth, and the extra capital has led to a short-term reduction in ROCE. And if the increased capital generates additional returns, the business, and thus shareholders, will benefit in the long run.
On a side note, Hubei Forbon TechnologyLtd has done well to pay down its current liabilities to 14% of total assets. That could partly explain why the ROCE has dropped. Effectively this means their suppliers or short-term creditors are funding less of the business, which reduces some elements of risk. Since the business is basically funding more of its operations with it's own money, you could argue this has made the business less efficient at generating ROCE.
In Conclusion...
Even though returns on capital have fallen in the short term, we find it promising that revenue and capital employed have both increased for Hubei Forbon TechnologyLtd. However, despite the promising trends, the stock has fallen 44% over the last five years, so there might be an opportunity here for astute investors. So we think it'd be worthwhile to look further into this stock given the trends look encouraging.
If you want to know some of the risks facing Hubei Forbon TechnologyLtd we've found 2 warning signs (1 is significant!) that you should be aware of before investing here.
While Hubei Forbon TechnologyLtd may not currently earn the highest returns, we've compiled a list of companies that currently earn more than 25% return on equity. Check out this free list here.
Valuation is complex, but we're here to simplify it.
Discover if Hubei Forbon TechnologyLtd might be undervalued or overvalued with our detailed analysis, featuring fair value estimates, potential risks, dividends, insider trades, and its financial condition.
Access Free AnalysisHave feedback on this article? Concerned about the content? Get in touch with us directly. Alternatively, email editorial-team (at) simplywallst.com.
This article by Simply Wall St is general in nature. We provide commentary based on historical data and analyst forecasts only using an unbiased methodology and our articles are not intended to be financial advice. It does not constitute a recommendation to buy or sell any stock, and does not take account of your objectives, or your financial situation. We aim to bring you long-term focused analysis driven by fundamental data. Note that our analysis may not factor in the latest price-sensitive company announcements or qualitative material. Simply Wall St has no position in any stocks mentioned.
About SZSE:300387
Hubei Forbon TechnologyLtd
Researches, develops, produces, and sells fertilizer additives in China and internationally.
Flawless balance sheet with high growth potential and pays a dividend.
Market Insights

Advertisement
Community Narratives
MicroVision will explode future revenue by 380.37% with a vision towards success
Fair Value US$60.00|98.4% undervalued
TH
Community Contributor
The Indispensable Artery for a New North American Economy
Fair Value CA$132.87|1.3% undervalued
TI
Community Contributor