
Advertisement
Shanghai Anoky Group Co., Ltd's (SZSE:300067) 28% Price Boost Is Out Of Tune With Revenues
Shanghai Anoky Group Co., Ltd (SZSE:300067) shareholders would be excited to see that the share price has had a great month, posting a 28% gain and recovering from prior weakness. Looking back a bit further, it's encouraging to see the stock is up 35% in the last year.
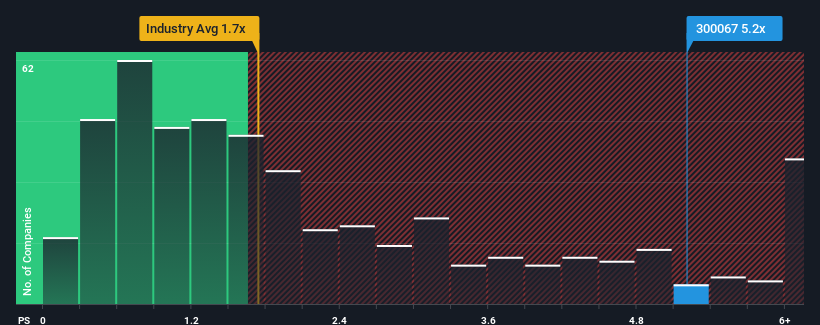
Following the firm bounce in price, when almost half of the companies in China's Chemicals industry have price-to-sales ratios (or "P/S") below 1.7x, you may consider Shanghai Anoky Group as a stock not worth researching with its 5.2x P/S ratio. Although, it's not wise to just take the P/S at face value as there may be an explanation why it's so lofty.
See our latest analysis for Shanghai Anoky Group
How Has Shanghai Anoky Group Performed Recently?
Shanghai Anoky Group has been doing a good job lately as it's been growing revenue at a solid pace. It might be that many expect the respectable revenue performance to beat most other companies over the coming period, which has increased investors’ willingness to pay up for the stock. You'd really hope so, otherwise you're paying a pretty hefty price for no particular reason.
Although there are no analyst estimates available for Shanghai Anoky Group, take a look at this free data-rich visualisation to see how the company stacks up on earnings, revenue and cash flow.How Is Shanghai Anoky Group's Revenue Growth Trending?
The only time you'd be truly comfortable seeing a P/S as steep as Shanghai Anoky Group's is when the company's growth is on track to outshine the industry decidedly.
Taking a look back first, we see that the company grew revenue by an impressive 28% last year. However, this wasn't enough as the latest three year period has seen the company endure a nasty 16% drop in revenue in aggregate. Accordingly, shareholders would have felt downbeat about the medium-term rates of revenue growth.
Weighing that medium-term revenue trajectory against the broader industry's one-year forecast for expansion of 22% shows it's an unpleasant look.
With this information, we find it concerning that Shanghai Anoky Group is trading at a P/S higher than the industry. It seems most investors are ignoring the recent poor growth rate and are hoping for a turnaround in the company's business prospects. There's a very good chance existing shareholders are setting themselves up for future disappointment if the P/S falls to levels more in line with the recent negative growth rates.
What Does Shanghai Anoky Group's P/S Mean For Investors?
Shares in Shanghai Anoky Group have seen a strong upwards swing lately, which has really helped boost its P/S figure. We'd say the price-to-sales ratio's power isn't primarily as a valuation instrument but rather to gauge current investor sentiment and future expectations.
Our examination of Shanghai Anoky Group revealed its shrinking revenue over the medium-term isn't resulting in a P/S as low as we expected, given the industry is set to grow. When we see revenue heading backwards and underperforming the industry forecasts, we feel the possibility of the share price declining is very real, bringing the P/S back into the realm of reasonability. Should recent medium-term revenue trends persist, it would pose a significant risk to existing shareholders' investments and prospective investors will have a hard time accepting the current value of the stock.
You should always think about risks. Case in point, we've spotted 5 warning signs for Shanghai Anoky Group you should be aware of, and 3 of them make us uncomfortable.
It's important to make sure you look for a great company, not just the first idea you come across. So if growing profitability aligns with your idea of a great company, take a peek at this free list of interesting companies with strong recent earnings growth (and a low P/E).
New: Manage All Your Stock Portfolios in One Place
We've created the ultimate portfolio companion for stock investors, and it's free.
• Connect an unlimited number of Portfolios and see your total in one currency
• Be alerted to new Warning Signs or Risks via email or mobile
• Track the Fair Value of your stocks
Have feedback on this article? Concerned about the content? Get in touch with us directly. Alternatively, email editorial-team (at) simplywallst.com.
This article by Simply Wall St is general in nature. We provide commentary based on historical data and analyst forecasts only using an unbiased methodology and our articles are not intended to be financial advice. It does not constitute a recommendation to buy or sell any stock, and does not take account of your objectives, or your financial situation. We aim to bring you long-term focused analysis driven by fundamental data. Note that our analysis may not factor in the latest price-sensitive company announcements or qualitative material. Simply Wall St has no position in any stocks mentioned.
About SZSE:300067
Shanghai Anoky Group
Provides dyeing and finishing solutions in China and internationally.
Mediocre balance sheet with minimal risk.
Market Insights

Advertisement
Community Narratives
MicroVision will explode future revenue by 380.37% with a vision towards success
Fair Value US$60.00|98.3% undervalued
TH
Community Contributor
The Indispensable Artery for a New North American Economy
Fair Value CA$132.87|1.0% undervalued
TI
Community Contributor