
Advertisement
Shanghai Anoky Group Co., Ltd (SZSE:300067) Shares May Have Slumped 31% But Getting In Cheap Is Still Unlikely
The Shanghai Anoky Group Co., Ltd (SZSE:300067) share price has softened a substantial 31% over the previous 30 days, handing back much of the gains the stock has made lately. Looking at the bigger picture, even after this poor month the stock is up 29% in the last year.
Even after such a large drop in price, when almost half of the companies in China's Chemicals industry have price-to-sales ratios (or "P/S") below 2x, you may still consider Shanghai Anoky Group as a stock not worth researching with its 5.5x P/S ratio. Although, it's not wise to just take the P/S at face value as there may be an explanation why it's so lofty.
View our latest analysis for Shanghai Anoky Group
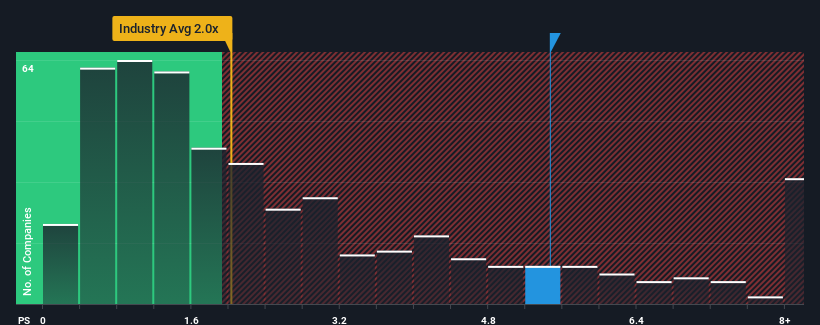
What Does Shanghai Anoky Group's Recent Performance Look Like?
As an illustration, revenue has deteriorated at Shanghai Anoky Group over the last year, which is not ideal at all. One possibility is that the P/S is high because investors think the company will still do enough to outperform the broader industry in the near future. If not, then existing shareholders may be quite nervous about the viability of the share price.
Want the full picture on earnings, revenue and cash flow for the company? Then our free report on Shanghai Anoky Group will help you shine a light on its historical performance.What Are Revenue Growth Metrics Telling Us About The High P/S?
In order to justify its P/S ratio, Shanghai Anoky Group would need to produce outstanding growth that's well in excess of the industry.
Retrospectively, the last year delivered a frustrating 12% decrease to the company's top line. The last three years don't look nice either as the company has shrunk revenue by 21% in aggregate. So unfortunately, we have to acknowledge that the company has not done a great job of growing revenue over that time.
Comparing that to the industry, which is predicted to deliver 21% growth in the next 12 months, the company's downward momentum based on recent medium-term revenue results is a sobering picture.
With this in mind, we find it worrying that Shanghai Anoky Group's P/S exceeds that of its industry peers. Apparently many investors in the company are way more bullish than recent times would indicate and aren't willing to let go of their stock at any price. There's a very good chance existing shareholders are setting themselves up for future disappointment if the P/S falls to levels more in line with the recent negative growth rates.
The Key Takeaway
Even after such a strong price drop, Shanghai Anoky Group's P/S still exceeds the industry median significantly. We'd say the price-to-sales ratio's power isn't primarily as a valuation instrument but rather to gauge current investor sentiment and future expectations.
We've established that Shanghai Anoky Group currently trades on a much higher than expected P/S since its recent revenues have been in decline over the medium-term. Right now we aren't comfortable with the high P/S as this revenue performance is highly unlikely to support such positive sentiment for long. Should recent medium-term revenue trends persist, it would pose a significant risk to existing shareholders' investments and prospective investors will have a hard time accepting the current value of the stock.
And what about other risks? Every company has them, and we've spotted 2 warning signs for Shanghai Anoky Group you should know about.
If these risks are making you reconsider your opinion on Shanghai Anoky Group, explore our interactive list of high quality stocks to get an idea of what else is out there.
New: Manage All Your Stock Portfolios in One Place
We've created the ultimate portfolio companion for stock investors, and it's free.
• Connect an unlimited number of Portfolios and see your total in one currency
• Be alerted to new Warning Signs or Risks via email or mobile
• Track the Fair Value of your stocks
Have feedback on this article? Concerned about the content? Get in touch with us directly. Alternatively, email editorial-team (at) simplywallst.com.
This article by Simply Wall St is general in nature. We provide commentary based on historical data and analyst forecasts only using an unbiased methodology and our articles are not intended to be financial advice. It does not constitute a recommendation to buy or sell any stock, and does not take account of your objectives, or your financial situation. We aim to bring you long-term focused analysis driven by fundamental data. Note that our analysis may not factor in the latest price-sensitive company announcements or qualitative material. Simply Wall St has no position in any stocks mentioned.
About SZSE:300067
Shanghai Anoky Group
Provides dyeing and finishing solutions in China and internationally.
Mediocre balance sheet with minimal risk.
Market Insights

Advertisement
Community Narratives
The company that turned a verb into a global necessity and basically runs the modern internet, digital ads, smartphones, maps, and AI.
Fair Value US$300.00|6.2% undervalued
OS
Community Contributor
Flowers Foods Pays A Fair Price For Health
Fair Value US$16.12|25.1% undervalued
NV
Community Contributor
TMX Group will thrive with 33.3% profit margin and enduring market moat
Fair Value CA$49.90|0.04% overvalued
LI
Community Contributor