
Advertisement
Guangdong Tengen Industrial Group Co.,Ltd.'s (SZSE:003003) 27% Price Boost Is Out Of Tune With Earnings
Guangdong Tengen Industrial Group Co.,Ltd. (SZSE:003003) shareholders are no doubt pleased to see that the share price has bounced 27% in the last month, although it is still struggling to make up recently lost ground. Unfortunately, the gains of the last month did little to right the losses of the last year with the stock still down 20% over that time.
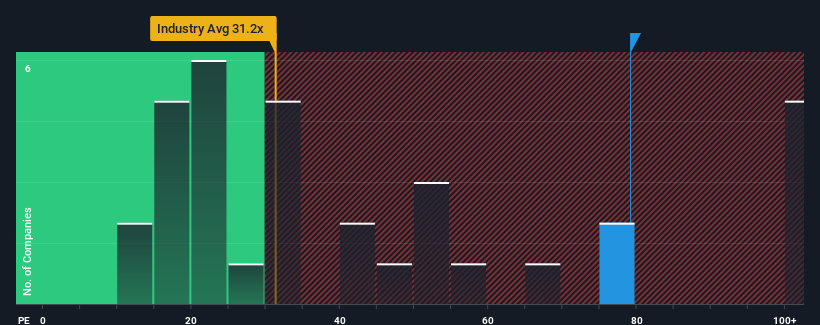
Following the firm bounce in price, Guangdong Tengen Industrial GroupLtd's price-to-earnings (or "P/E") ratio of 79.1x might make it look like a strong sell right now compared to the market in China, where around half of the companies have P/E ratios below 31x and even P/E's below 18x are quite common. Nonetheless, we'd need to dig a little deeper to determine if there is a rational basis for the highly elevated P/E.
With earnings growth that's exceedingly strong of late, Guangdong Tengen Industrial GroupLtd has been doing very well. The P/E is probably high because investors think this strong earnings growth will be enough to outperform the broader market in the near future. If not, then existing shareholders might be a little nervous about the viability of the share price.
View our latest analysis for Guangdong Tengen Industrial GroupLtd
Does Growth Match The High P/E?
There's an inherent assumption that a company should far outperform the market for P/E ratios like Guangdong Tengen Industrial GroupLtd's to be considered reasonable.
If we review the last year of earnings growth, the company posted a terrific increase of 95%. Despite this strong recent growth, it's still struggling to catch up as its three-year EPS frustratingly shrank by 78% overall. Therefore, it's fair to say the earnings growth recently has been undesirable for the company.
In contrast to the company, the rest of the market is expected to grow by 40% over the next year, which really puts the company's recent medium-term earnings decline into perspective.
In light of this, it's alarming that Guangdong Tengen Industrial GroupLtd's P/E sits above the majority of other companies. It seems most investors are ignoring the recent poor growth rate and are hoping for a turnaround in the company's business prospects. There's a very good chance existing shareholders are setting themselves up for future disappointment if the P/E falls to levels more in line with the recent negative growth rates.
The Final Word
Guangdong Tengen Industrial GroupLtd's P/E is flying high just like its stock has during the last month. Using the price-to-earnings ratio alone to determine if you should sell your stock isn't sensible, however it can be a practical guide to the company's future prospects.
We've established that Guangdong Tengen Industrial GroupLtd currently trades on a much higher than expected P/E since its recent earnings have been in decline over the medium-term. Right now we are increasingly uncomfortable with the high P/E as this earnings performance is highly unlikely to support such positive sentiment for long. Unless the recent medium-term conditions improve markedly, it's very challenging to accept these prices as being reasonable.
You should always think about risks. Case in point, we've spotted 3 warning signs for Guangdong Tengen Industrial GroupLtd you should be aware of, and 1 of them is a bit concerning.
It's important to make sure you look for a great company, not just the first idea you come across. So take a peek at this free list of interesting companies with strong recent earnings growth (and a low P/E).
New: Manage All Your Stock Portfolios in One Place
We've created the ultimate portfolio companion for stock investors, and it's free.
• Connect an unlimited number of Portfolios and see your total in one currency
• Be alerted to new Warning Signs or Risks via email or mobile
• Track the Fair Value of your stocks
Have feedback on this article? Concerned about the content? Get in touch with us directly. Alternatively, email editorial-team (at) simplywallst.com.
This article by Simply Wall St is general in nature. We provide commentary based on historical data and analyst forecasts only using an unbiased methodology and our articles are not intended to be financial advice. It does not constitute a recommendation to buy or sell any stock, and does not take account of your objectives, or your financial situation. We aim to bring you long-term focused analysis driven by fundamental data. Note that our analysis may not factor in the latest price-sensitive company announcements or qualitative material. Simply Wall St has no position in any stocks mentioned.
About SZSE:003003
Guangdong Tengen Industrial GroupLtd
Guangdong Tengen Industrial Group Co.,Ltd.
Excellent balance sheet and good value.
Market Insights

Advertisement
Community Narratives
MicroVision will explode future revenue by 380.37% with a vision towards success
Fair Value US$60.00|98.4% undervalued
TH
Community Contributor
The Indispensable Artery for a New North American Economy
Fair Value CA$132.87|1.1% undervalued
TI
Community Contributor