Shandong Head Group Co.,Ltd. (SZSE:002810) adds CN¥437m in market cap and insiders have a 46% stake in that gain


Key Insights
- Shandong Head GroupLtd's significant insider ownership suggests inherent interests in company's expansion
- A total of 9 investors have a majority stake in the company with 51% ownership
- Institutional ownership in Shandong Head GroupLtd is 10%
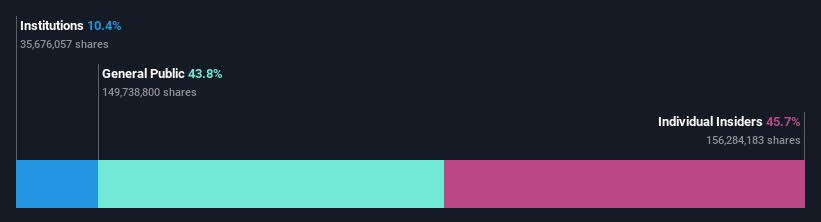
Every investor in Shandong Head Group Co.,Ltd. (SZSE:002810) should be aware of the most powerful shareholder groups. And the group that holds the biggest piece of the pie are individual insiders with 46% ownership. That is, the group stands to benefit the most if the stock rises (or lose the most if there is a downturn).
Clearly, insiders benefitted the most after the company's market cap rose by CN¥437m last week.
Let's delve deeper into each type of owner of Shandong Head GroupLtd, beginning with the chart below.
View our latest analysis for Shandong Head GroupLtd
What Does The Institutional Ownership Tell Us About Shandong Head GroupLtd?
Institutional investors commonly compare their own returns to the returns of a commonly followed index. So they generally do consider buying larger companies that are included in the relevant benchmark index.
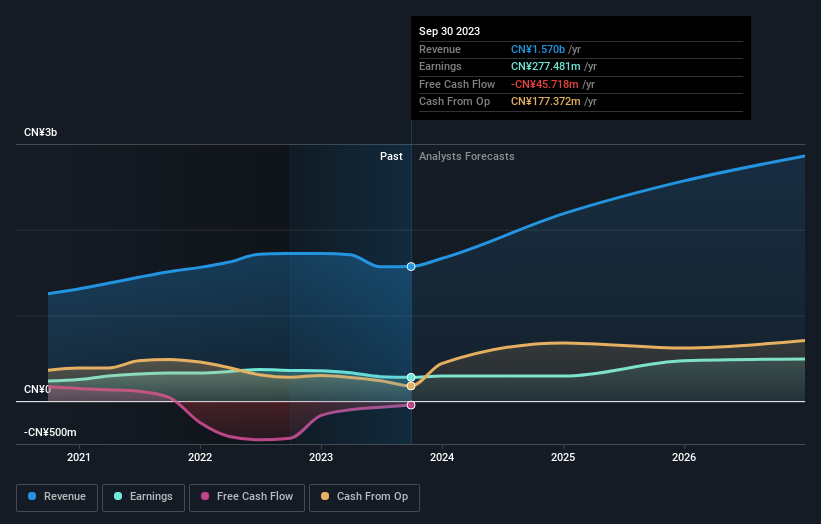
Shandong Head GroupLtd already has institutions on the share registry. Indeed, they own a respectable stake in the company. This suggests some credibility amongst professional investors. But we can't rely on that fact alone since institutions make bad investments sometimes, just like everyone does. It is not uncommon to see a big share price drop if two large institutional investors try to sell out of a stock at the same time. So it is worth checking the past earnings trajectory of Shandong Head GroupLtd, (below). Of course, keep in mind that there are other factors to consider, too.
Shandong Head GroupLtd is not owned by hedge funds. Xinde Bi is currently the company's largest shareholder with 33% of shares outstanding. With 7.8% and 2.5% of the shares outstanding respectively, Yu Dong Bi and Li Yang are the second and third largest shareholders.
We also observed that the top 9 shareholders account for more than half of the share register, with a few smaller shareholders to balance the interests of the larger ones to a certain extent.
Researching institutional ownership is a good way to gauge and filter a stock's expected performance. The same can be achieved by studying analyst sentiments. There are plenty of analysts covering the stock, so it might be worth seeing what they are forecasting, too.
Insider Ownership Of Shandong Head GroupLtd
The definition of an insider can differ slightly between different countries, but members of the board of directors always count. Company management run the business, but the CEO will answer to the board, even if he or she is a member of it.
Insider ownership is positive when it signals leadership are thinking like the true owners of the company. However, high insider ownership can also give immense power to a small group within the company. This can be negative in some circumstances.
Our most recent data indicates that insiders own a reasonable proportion of Shandong Head Group Co.,Ltd.. Insiders own CN¥2.5b worth of shares in the CN¥5.4b company. We would say this shows alignment with shareholders, but it is worth noting that the company is still quite small; some insiders may have founded the business. You can click here to see if those insiders have been buying or selling.
General Public Ownership
The general public, who are usually individual investors, hold a 44% stake in Shandong Head GroupLtd. While this size of ownership may not be enough to sway a policy decision in their favour, they can still make a collective impact on company policies.
Next Steps:
While it is well worth considering the different groups that own a company, there are other factors that are even more important. For instance, we've identified 1 warning sign for Shandong Head GroupLtd that you should be aware of.
If you would prefer discover what analysts are predicting in terms of future growth, do not miss this free report on analyst forecasts.
NB: Figures in this article are calculated using data from the last twelve months, which refer to the 12-month period ending on the last date of the month the financial statement is dated. This may not be consistent with full year annual report figures.
New: Manage All Your Stock Portfolios in One Place
We've created the ultimate portfolio companion for stock investors, and it's free.
• Connect an unlimited number of Portfolios and see your total in one currency
• Be alerted to new Warning Signs or Risks via email or mobile
• Track the Fair Value of your stocks
Have feedback on this article? Concerned about the content? Get in touch with us directly. Alternatively, email editorial-team (at) simplywallst.com.
This article by Simply Wall St is general in nature. We provide commentary based on historical data and analyst forecasts only using an unbiased methodology and our articles are not intended to be financial advice. It does not constitute a recommendation to buy or sell any stock, and does not take account of your objectives, or your financial situation. We aim to bring you long-term focused analysis driven by fundamental data. Note that our analysis may not factor in the latest price-sensitive company announcements or qualitative material. Simply Wall St has no position in any stocks mentioned.
About SZSE:002810
Shandong Head GroupLtd
Engages in the scientific research, development, production, and sale of non-ionic cellulose ether products in the People’s Republic of China and internationally.
Flawless balance sheet with high growth potential.
