- China
- /
- Metals and Mining
- /
- SZSE:000878
As Yunnan CopperLtd (SZSE:000878) advances 5.6% this past week, investors may now be noticing the company's three-year earnings growth


One of the frustrations of investing is when a stock goes down. But it can difficult to make money in a declining market. While the Yunnan Copper Co.,Ltd (SZSE:000878) share price is down 29% in the last three years, the total return to shareholders (which includes dividends) was -23%. That's better than the market which declined 33% over the last three years. The falls have accelerated recently, with the share price down 12% in the last three months. However, one could argue that the price has been influenced by the general market, which is down 11% in the same timeframe.
While the stock has risen 5.6% in the past week but long term shareholders are still in the red, let's see what the fundamentals can tell us.
Check out our latest analysis for Yunnan CopperLtd
To paraphrase Benjamin Graham: Over the short term the market is a voting machine, but over the long term it's a weighing machine. By comparing earnings per share (EPS) and share price changes over time, we can get a feel for how investor attitudes to a company have morphed over time.
Although the share price is down over three years, Yunnan CopperLtd actually managed to grow EPS by 58% per year in that time. This is quite a puzzle, and suggests there might be something temporarily buoying the share price. Or else the company was over-hyped in the past, and so its growth has disappointed.
Since the change in EPS doesn't seem to correlate with the change in share price, it's worth taking a look at other metrics.
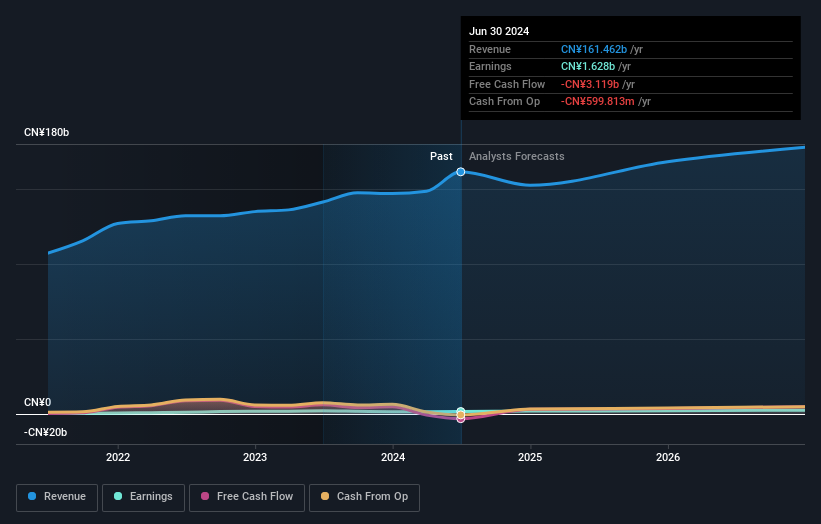
With a rather small yield of just 0.5% we doubt that the stock's share price is based on its dividend. Revenue is actually up 11% over the three years, so the share price drop doesn't seem to hinge on revenue, either. This analysis is just perfunctory, but it might be worth researching Yunnan CopperLtd more closely, as sometimes stocks fall unfairly. This could present an opportunity.
You can see how earnings and revenue have changed over time in the image below (click on the chart to see the exact values).
It is of course excellent to see how Yunnan CopperLtd has grown profits over the years, but the future is more important for shareholders. This free interactive report on Yunnan CopperLtd's balance sheet strength is a great place to start, if you want to investigate the stock further.
What About Dividends?
As well as measuring the share price return, investors should also consider the total shareholder return (TSR). The TSR is a return calculation that accounts for the value of cash dividends (assuming that any dividend received was reinvested) and the calculated value of any discounted capital raisings and spin-offs. It's fair to say that the TSR gives a more complete picture for stocks that pay a dividend. In the case of Yunnan CopperLtd, it has a TSR of -23% for the last 3 years. That exceeds its share price return that we previously mentioned. This is largely a result of its dividend payments!
A Different Perspective
While it's never nice to take a loss, Yunnan CopperLtd shareholders can take comfort that , including dividends,their trailing twelve month loss of 2.7% wasn't as bad as the market loss of around 19%. Of course, the long term returns are far more important and the good news is that over five years, the stock has returned 4% for each year. In the best case scenario the last year is just a temporary blip on the journey to a brighter future. I find it very interesting to look at share price over the long term as a proxy for business performance. But to truly gain insight, we need to consider other information, too. Case in point: We've spotted 2 warning signs for Yunnan CopperLtd you should be aware of, and 1 of them shouldn't be ignored.
If you are like me, then you will not want to miss this free list of undervalued small caps that insiders are buying.
Please note, the market returns quoted in this article reflect the market weighted average returns of stocks that currently trade on Chinese exchanges.
New: Manage All Your Stock Portfolios in One Place
We've created the ultimate portfolio companion for stock investors, and it's free.
• Connect an unlimited number of Portfolios and see your total in one currency
• Be alerted to new Warning Signs or Risks via email or mobile
• Track the Fair Value of your stocks
Have feedback on this article? Concerned about the content? Get in touch with us directly. Alternatively, email editorial-team (at) simplywallst.com.
This article by Simply Wall St is general in nature. We provide commentary based on historical data and analyst forecasts only using an unbiased methodology and our articles are not intended to be financial advice. It does not constitute a recommendation to buy or sell any stock, and does not take account of your objectives, or your financial situation. We aim to bring you long-term focused analysis driven by fundamental data. Note that our analysis may not factor in the latest price-sensitive company announcements or qualitative material. Simply Wall St has no position in any stocks mentioned.
About SZSE:000878
Yunnan CopperLtd
Engages in the copper exploration, mining, and smelting activities in China.
Undervalued with adequate balance sheet.

