Sichuan Meifeng Chemical Industry's (SZSE:000731) 9.3% CAGR outpaced the company's earnings growth over the same five-year period


Stock pickers are generally looking for stocks that will outperform the broader market. And in our experience, buying the right stocks can give your wealth a significant boost. To wit, the Sichuan Meifeng Chemical Industry share price has climbed 45% in five years, easily topping the market return of 7.8% (ignoring dividends). However, more recent returns haven't been as impressive as that, with the stock returning just 3.8% in the last year, including dividends.
After a strong gain in the past week, it's worth seeing if longer term returns have been driven by improving fundamentals.
View our latest analysis for Sichuan Meifeng Chemical Industry
While the efficient markets hypothesis continues to be taught by some, it has been proven that markets are over-reactive dynamic systems, and investors are not always rational. One way to examine how market sentiment has changed over time is to look at the interaction between a company's share price and its earnings per share (EPS).
During five years of share price growth, Sichuan Meifeng Chemical Industry achieved compound earnings per share (EPS) growth of 14% per year. This EPS growth is higher than the 8% average annual increase in the share price. So it seems the market isn't so enthusiastic about the stock these days.
The graphic below depicts how EPS has changed over time (unveil the exact values by clicking on the image).
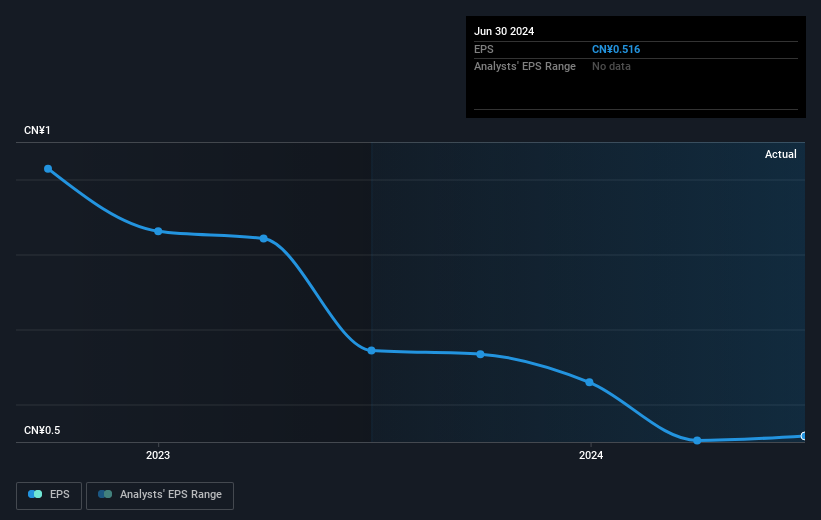
Dive deeper into Sichuan Meifeng Chemical Industry's key metrics by checking this interactive graph of Sichuan Meifeng Chemical Industry's earnings, revenue and cash flow.
What About Dividends?
As well as measuring the share price return, investors should also consider the total shareholder return (TSR). The TSR incorporates the value of any spin-offs or discounted capital raisings, along with any dividends, based on the assumption that the dividends are reinvested. It's fair to say that the TSR gives a more complete picture for stocks that pay a dividend. As it happens, Sichuan Meifeng Chemical Industry's TSR for the last 5 years was 56%, which exceeds the share price return mentioned earlier. This is largely a result of its dividend payments!
A Different Perspective
It's good to see that Sichuan Meifeng Chemical Industry has rewarded shareholders with a total shareholder return of 3.8% in the last twelve months. That's including the dividend. However, that falls short of the 9% TSR per annum it has made for shareholders, each year, over five years. Potential buyers might understandably feel they've missed the opportunity, but it's always possible business is still firing on all cylinders. It's always interesting to track share price performance over the longer term. But to understand Sichuan Meifeng Chemical Industry better, we need to consider many other factors. For example, we've discovered 1 warning sign for Sichuan Meifeng Chemical Industry that you should be aware of before investing here.
If you like to buy stocks alongside management, then you might just love this free list of companies. (Hint: many of them are unnoticed AND have attractive valuation).
Please note, the market returns quoted in this article reflect the market weighted average returns of stocks that currently trade on Chinese exchanges.
New: Manage All Your Stock Portfolios in One Place
We've created the ultimate portfolio companion for stock investors, and it's free.
• Connect an unlimited number of Portfolios and see your total in one currency
• Be alerted to new Warning Signs or Risks via email or mobile
• Track the Fair Value of your stocks
Have feedback on this article? Concerned about the content? Get in touch with us directly. Alternatively, email editorial-team (at) simplywallst.com.
This article by Simply Wall St is general in nature. We provide commentary based on historical data and analyst forecasts only using an unbiased methodology and our articles are not intended to be financial advice. It does not constitute a recommendation to buy or sell any stock, and does not take account of your objectives, or your financial situation. We aim to bring you long-term focused analysis driven by fundamental data. Note that our analysis may not factor in the latest price-sensitive company announcements or qualitative material. Simply Wall St has no position in any stocks mentioned.
About SZSE:000731
Sichuan Meifeng Chemical Industry
Sichuan Meifeng Chemical Industry Co., Ltd.
Flawless balance sheet established dividend payer.

