- China
- /
- Metals and Mining
- /
- SZSE:000633
Is Xinjiang Hejin Holding Co.,Ltd's (SZSE:000633) Recent Price Movement Underpinned By Its Weak Fundamentals?


Xinjiang Hejin HoldingLtd (SZSE:000633) has had a rough month with its share price down 20%. We, however decided to study the company's financials to determine if they have got anything to do with the price decline. Long-term fundamentals are usually what drive market outcomes, so it's worth paying close attention. Particularly, we will be paying attention to Xinjiang Hejin HoldingLtd's ROE today.
Return on equity or ROE is a key measure used to assess how efficiently a company's management is utilizing the company's capital. In short, ROE shows the profit each dollar generates with respect to its shareholder investments.
Check out our latest analysis for Xinjiang Hejin HoldingLtd
How Is ROE Calculated?
The formula for ROE is:
Return on Equity = Net Profit (from continuing operations) ÷ Shareholders' Equity
So, based on the above formula, the ROE for Xinjiang Hejin HoldingLtd is:
3.3% = CN¥5.9m ÷ CN¥180m (Based on the trailing twelve months to March 2024).
The 'return' is the income the business earned over the last year. That means that for every CN¥1 worth of shareholders' equity, the company generated CN¥0.03 in profit.
Why Is ROE Important For Earnings Growth?
So far, we've learned that ROE is a measure of a company's profitability. Depending on how much of these profits the company reinvests or "retains", and how effectively it does so, we are then able to assess a company’s earnings growth potential. Assuming all else is equal, companies that have both a higher return on equity and higher profit retention are usually the ones that have a higher growth rate when compared to companies that don't have the same features.
Xinjiang Hejin HoldingLtd's Earnings Growth And 3.3% ROE
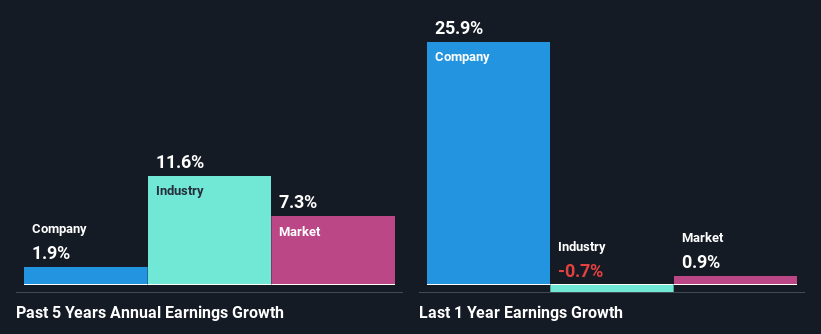
It is hard to argue that Xinjiang Hejin HoldingLtd's ROE is much good in and of itself. Even compared to the average industry ROE of 7.4%, the company's ROE is quite dismal. As a result, Xinjiang Hejin HoldingLtd's flat earnings over the past five years doesn't come as a surprise given its lower ROE.
We then compared Xinjiang Hejin HoldingLtd's net income growth with the industry and found that the company's growth figure is lower than the average industry growth rate of 12% in the same 5-year period, which is a bit concerning.
Earnings growth is an important metric to consider when valuing a stock. The investor should try to establish if the expected growth or decline in earnings, whichever the case may be, is priced in. This then helps them determine if the stock is placed for a bright or bleak future. If you're wondering about Xinjiang Hejin HoldingLtd's's valuation, check out this gauge of its price-to-earnings ratio, as compared to its industry.
Is Xinjiang Hejin HoldingLtd Making Efficient Use Of Its Profits?
Xinjiang Hejin HoldingLtd doesn't pay any regular dividends, which means that it is retaining all of its earnings. This makes us question why the company is retaining so much of its profits and still generating almost no growth? It looks like there might be some other reasons to explain the lack in that respect. For example, the business could be in decline.
Conclusion
Overall, we have mixed feelings about Xinjiang Hejin HoldingLtd. While the company does have a high rate of reinvestment, the low ROE means that all that reinvestment is not reaping any benefit to its investors, and moreover, its having a negative impact on the earnings growth. So far, we've only made a quick discussion around the company's earnings growth. To gain further insights into Xinjiang Hejin HoldingLtd's past profit growth, check out this visualization of past earnings, revenue and cash flows.
New: AI Stock Screener & Alerts
Our new AI Stock Screener scans the market every day to uncover opportunities.
• Dividend Powerhouses (3%+ Yield)
• Undervalued Small Caps with Insider Buying
• High growth Tech and AI Companies
Or build your own from over 50 metrics.
Have feedback on this article? Concerned about the content? Get in touch with us directly. Alternatively, email editorial-team (at) simplywallst.com.
This article by Simply Wall St is general in nature. We provide commentary based on historical data and analyst forecasts only using an unbiased methodology and our articles are not intended to be financial advice. It does not constitute a recommendation to buy or sell any stock, and does not take account of your objectives, or your financial situation. We aim to bring you long-term focused analysis driven by fundamental data. Note that our analysis may not factor in the latest price-sensitive company announcements or qualitative material. Simply Wall St has no position in any stocks mentioned.
About SZSE:000633
Xinjiang Hejin HoldingLtd
Engages in the production and sale of wire rods and high-temperature materials, which are used in metal shackles in China.
Solid track record with excellent balance sheet.
