
Advertisement
Risks To Shareholder Returns Are Elevated At These Prices For Guangzhou Sanfu New Materials Technology Co.,Ltd (SHSE:688359)
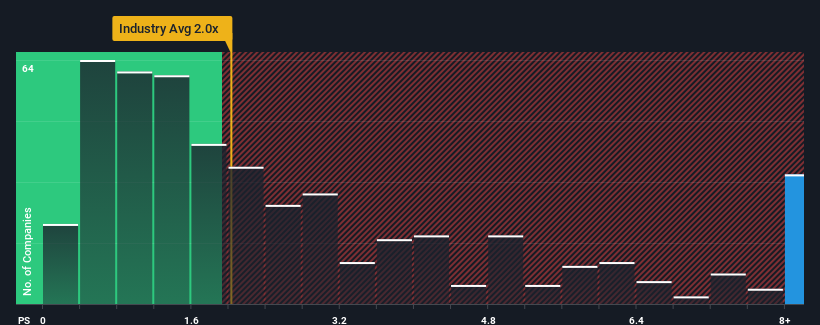
Guangzhou Sanfu New Materials Technology Co.,Ltd's (SHSE:688359) price-to-sales (or "P/S") ratio of 9.2x may look like a poor investment opportunity when you consider close to half the companies in the Chemicals industry in China have P/S ratios below 2x. However, the P/S might be quite high for a reason and it requires further investigation to determine if it's justified.
Check out our latest analysis for Guangzhou Sanfu New Materials TechnologyLtd
What Does Guangzhou Sanfu New Materials TechnologyLtd's P/S Mean For Shareholders?
Guangzhou Sanfu New Materials TechnologyLtd certainly has been doing a great job lately as it's been growing its revenue at a really rapid pace. Perhaps the market is expecting future revenue performance to outperform the wider market, which has seemingly got people interested in the stock. If not, then existing shareholders might be a little nervous about the viability of the share price.
We don't have analyst forecasts, but you can see how recent trends are setting up the company for the future by checking out our free report on Guangzhou Sanfu New Materials TechnologyLtd's earnings, revenue and cash flow.How Is Guangzhou Sanfu New Materials TechnologyLtd's Revenue Growth Trending?
The only time you'd be truly comfortable seeing a P/S as steep as Guangzhou Sanfu New Materials TechnologyLtd's is when the company's growth is on track to outshine the industry decidedly.
Retrospectively, the last year delivered an exceptional 37% gain to the company's top line. The latest three year period has also seen an excellent 75% overall rise in revenue, aided by its short-term performance. Accordingly, shareholders would have definitely welcomed those medium-term rates of revenue growth.
Weighing that recent medium-term revenue trajectory against the broader industry's one-year forecast for expansion of 21% shows it's about the same on an annualised basis.
With this in mind, we find it intriguing that Guangzhou Sanfu New Materials TechnologyLtd's P/S exceeds that of its industry peers. It seems most investors are ignoring the fairly average recent growth rates and are willing to pay up for exposure to the stock. Nevertheless, they may be setting themselves up for future disappointment if the P/S falls to levels more in line with recent growth rates.
What Does Guangzhou Sanfu New Materials TechnologyLtd's P/S Mean For Investors?
We'd say the price-to-sales ratio's power isn't primarily as a valuation instrument but rather to gauge current investor sentiment and future expectations.
Our examination of Guangzhou Sanfu New Materials TechnologyLtd revealed its three-year revenue trends aren't impacting its high P/S as much as we would have predicted, given they look similar to current industry expectations. When we see average revenue with industry-like growth combined with a high P/S, we suspect the share price is at risk of declining, bringing the P/S back in line with the industry too. If recent medium-term revenue trends continue, it will place shareholders' investments at risk and potential investors in danger of paying an unnecessary premium.
It's always necessary to consider the ever-present spectre of investment risk. We've identified 2 warning signs with Guangzhou Sanfu New Materials TechnologyLtd (at least 1 which is potentially serious), and understanding them should be part of your investment process.
If you're unsure about the strength of Guangzhou Sanfu New Materials TechnologyLtd's business, why not explore our interactive list of stocks with solid business fundamentals for some other companies you may have missed.
New: Manage All Your Stock Portfolios in One Place
We've created the ultimate portfolio companion for stock investors, and it's free.
• Connect an unlimited number of Portfolios and see your total in one currency
• Be alerted to new Warning Signs or Risks via email or mobile
• Track the Fair Value of your stocks
Have feedback on this article? Concerned about the content? Get in touch with us directly. Alternatively, email editorial-team (at) simplywallst.com.
This article by Simply Wall St is general in nature. We provide commentary based on historical data and analyst forecasts only using an unbiased methodology and our articles are not intended to be financial advice. It does not constitute a recommendation to buy or sell any stock, and does not take account of your objectives, or your financial situation. We aim to bring you long-term focused analysis driven by fundamental data. Note that our analysis may not factor in the latest price-sensitive company announcements or qualitative material. Simply Wall St has no position in any stocks mentioned.
About SHSE:688359
Guangzhou Sanfu New Materials TechnologyLtd
Engages in the research and development, production, and sale of new environmentally friendly surface engineering special chemicals in China.
Mediocre balance sheet with very low risk.
Market Insights

Advertisement
Community Narratives
MicroVision will explode future revenue by 380.37% with a vision towards success
Fair Value US$60.00|98.4% undervalued
TH
Community Contributor
The Indispensable Artery for a New North American Economy
Fair Value CA$132.87|1.3% undervalued
TI
Community Contributor