
Advertisement
- China
- /
- Metals and Mining
- /
- SHSE:603979
An Intrinsic Calculation For JCHX Mining Management Co.,Ltd. (SHSE:603979) Suggests It's 44% Undervalued

Key Insights
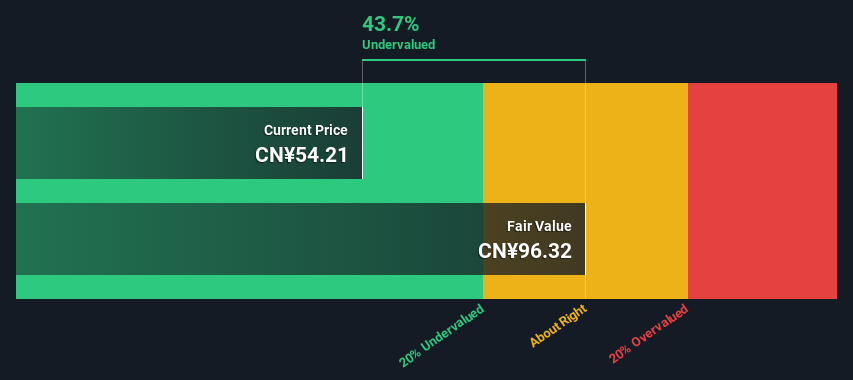
- JCHX Mining ManagementLtd's estimated fair value is CN¥96.32 based on 2 Stage Free Cash Flow to Equity
- Current share price of CN¥54.21 suggests JCHX Mining ManagementLtd is potentially 44% undervalued
- Our fair value estimate is 105% higher than JCHX Mining ManagementLtd's analyst price target of CN¥47.00
In this article we are going to estimate the intrinsic value of JCHX Mining Management Co.,Ltd. (SHSE:603979) by projecting its future cash flows and then discounting them to today's value. We will use the Discounted Cash Flow (DCF) model on this occasion. Models like these may appear beyond the comprehension of a lay person, but they're fairly easy to follow.
We would caution that there are many ways of valuing a company and, like the DCF, each technique has advantages and disadvantages in certain scenarios. If you still have some burning questions about this type of valuation, take a look at the Simply Wall St analysis model.
Check out our latest analysis for JCHX Mining ManagementLtd
Crunching The Numbers
We use what is known as a 2-stage model, which simply means we have two different periods of growth rates for the company's cash flows. Generally the first stage is higher growth, and the second stage is a lower growth phase. To begin with, we have to get estimates of the next ten years of cash flows. Where possible we use analyst estimates, but when these aren't available we extrapolate the previous free cash flow (FCF) from the last estimate or reported value. We assume companies with shrinking free cash flow will slow their rate of shrinkage, and that companies with growing free cash flow will see their growth rate slow, over this period. We do this to reflect that growth tends to slow more in the early years than it does in later years.
Generally we assume that a dollar today is more valuable than a dollar in the future, so we discount the value of these future cash flows to their estimated value in today's dollars:
10-year free cash flow (FCF) estimate
| 2024 | 2025 | 2026 | 2027 | 2028 | 2029 | 2030 | 2031 | 2032 | 2033 | |
| Levered FCF (CN¥, Millions) | -CN¥83.0m | CN¥719.0m | CN¥1.32b | CN¥2.11b | CN¥3.00b | CN¥3.92b | CN¥4.80b | CN¥5.59b | CN¥6.29b | CN¥6.89b |
| Growth Rate Estimate Source | Analyst x1 | Analyst x1 | Est @ 83.73% | Est @ 59.49% | Est @ 42.53% | Est @ 30.65% | Est @ 22.34% | Est @ 16.52% | Est @ 12.44% | Est @ 9.59% |
| Present Value (CN¥, Millions) Discounted @ 9.7% | -CN¥75.7 | CN¥598 | CN¥1.0k | CN¥1.5k | CN¥1.9k | CN¥2.3k | CN¥2.5k | CN¥2.7k | CN¥2.7k | CN¥2.7k |
("Est" = FCF growth rate estimated by Simply Wall St)
Present Value of 10-year Cash Flow (PVCF) = CN¥18b
The second stage is also known as Terminal Value, this is the business's cash flow after the first stage. For a number of reasons a very conservative growth rate is used that cannot exceed that of a country's GDP growth. In this case we have used the 5-year average of the 10-year government bond yield (2.9%) to estimate future growth. In the same way as with the 10-year 'growth' period, we discount future cash flows to today's value, using a cost of equity of 9.7%.
Terminal Value (TV)= FCF2033 × (1 + g) ÷ (r – g) = CN¥6.9b× (1 + 2.9%) ÷ (9.7%– 2.9%) = CN¥105b
Present Value of Terminal Value (PVTV)= TV / (1 + r)10= CN¥105b÷ ( 1 + 9.7%)10= CN¥42b
The total value, or equity value, is then the sum of the present value of the future cash flows, which in this case is CN¥59b. In the final step we divide the equity value by the number of shares outstanding. Compared to the current share price of CN¥54.2, the company appears quite undervalued at a 44% discount to where the stock price trades currently. The assumptions in any calculation have a big impact on the valuation, so it is better to view this as a rough estimate, not precise down to the last cent.
Important Assumptions
The calculation above is very dependent on two assumptions. The first is the discount rate and the other is the cash flows. Part of investing is coming up with your own evaluation of a company's future performance, so try the calculation yourself and check your own assumptions. The DCF also does not consider the possible cyclicality of an industry, or a company's future capital requirements, so it does not give a full picture of a company's potential performance. Given that we are looking at JCHX Mining ManagementLtd as potential shareholders, the cost of equity is used as the discount rate, rather than the cost of capital (or weighted average cost of capital, WACC) which accounts for debt. In this calculation we've used 9.7%, which is based on a levered beta of 1.198. Beta is a measure of a stock's volatility, compared to the market as a whole. We get our beta from the industry average beta of globally comparable companies, with an imposed limit between 0.8 and 2.0, which is a reasonable range for a stable business.
SWOT Analysis for JCHX Mining ManagementLtd
Strength
- Earnings growth over the past year exceeded the industry.
- Debt is not viewed as a risk.
Weakness
- Dividend is low compared to the top 25% of dividend payers in the Metals and Mining market.
- Shareholders have been diluted in the past year.
Opportunity
- Annual earnings are forecast to grow faster than the Chinese market.
- Trading below our estimate of fair value by more than 20%.
Threat
- No apparent threats visible for 603979.
Looking Ahead:
Although the valuation of a company is important, it shouldn't be the only metric you look at when researching a company. DCF models are not the be-all and end-all of investment valuation. Preferably you'd apply different cases and assumptions and see how they would impact the company's valuation. If a company grows at a different rate, or if its cost of equity or risk free rate changes sharply, the output can look very different. Why is the intrinsic value higher than the current share price? For JCHX Mining ManagementLtd, we've put together three essential elements you should further examine:
- Risks: Case in point, we've spotted 2 warning signs for JCHX Mining ManagementLtd you should be aware of, and 1 of them doesn't sit too well with us.
- Future Earnings: How does 603979's growth rate compare to its peers and the wider market? Dig deeper into the analyst consensus number for the upcoming years by interacting with our free analyst growth expectation chart.
- Other Solid Businesses: Low debt, high returns on equity and good past performance are fundamental to a strong business. Why not explore our interactive list of stocks with solid business fundamentals to see if there are other companies you may not have considered!
PS. Simply Wall St updates its DCF calculation for every Chinese stock every day, so if you want to find the intrinsic value of any other stock just search here.
New: Manage All Your Stock Portfolios in One Place
We've created the ultimate portfolio companion for stock investors, and it's free.
• Connect an unlimited number of Portfolios and see your total in one currency
• Be alerted to new Warning Signs or Risks via email or mobile
• Track the Fair Value of your stocks
Have feedback on this article? Concerned about the content? Get in touch with us directly. Alternatively, email editorial-team (at) simplywallst.com.
This article by Simply Wall St is general in nature. We provide commentary based on historical data and analyst forecasts only using an unbiased methodology and our articles are not intended to be financial advice. It does not constitute a recommendation to buy or sell any stock, and does not take account of your objectives, or your financial situation. We aim to bring you long-term focused analysis driven by fundamental data. Note that our analysis may not factor in the latest price-sensitive company announcements or qualitative material. Simply Wall St has no position in any stocks mentioned.
About SHSE:603979
JCHX Mining ManagementLtd
Engages in mine engineering, development, and construction activities in the People’s Republic of China and internationally.
Very undervalued with solid track record.
Market Insights

Advertisement
Community Narratives
The Future of Drug Testing? Fingerprint Tech Shows Serious Promise
Fair Value US$2.98|36.2% undervalued
JO
Community Contributor
Occidental Petroleum is set to achieve a 16% profit margin improvement
Fair Value US$55.05|18.7% undervalued
DZ
Community Contributor
Argan's Revenue Set to Soar with a 13.31% Growth in the Coming Decade
Fair Value US$284.68|22.0% undervalued
KE
Community Contributor
EU#1 - From German Startup to EU’s Biggest Company
Fair Value €248.62|5.0% overvalued
TO
Community Contributor