
Advertisement
Sanxiang Advanced Materials Co., Ltd.'s (SHSE:603663) Earnings Haven't Escaped The Attention Of Investors
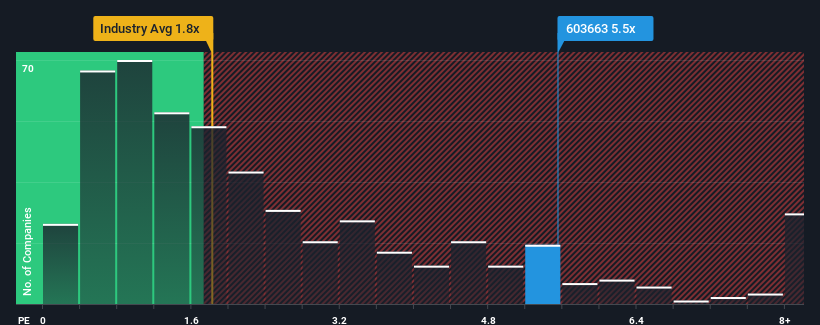
Sanxiang Advanced Materials Co., Ltd.'s (SHSE:603663) price-to-sales (or "P/S") ratio of 5.5x may look like a poor investment opportunity when you consider close to half the companies in the Chemicals industry in China have P/S ratios below 1.8x. Nonetheless, we'd need to dig a little deeper to determine if there is a rational basis for the highly elevated P/S.
See our latest analysis for Sanxiang Advanced Materials
What Does Sanxiang Advanced Materials' P/S Mean For Shareholders?
Sanxiang Advanced Materials hasn't been tracking well recently as its declining revenue compares poorly to other companies, which have seen some growth in their revenues on average. Perhaps the market is expecting the poor revenue to reverse, justifying it's current high P/S.. However, if this isn't the case, investors might get caught out paying too much for the stock.
If you'd like to see what analysts are forecasting going forward, you should check out our free report on Sanxiang Advanced Materials.What Are Revenue Growth Metrics Telling Us About The High P/S?
In order to justify its P/S ratio, Sanxiang Advanced Materials would need to produce outstanding growth that's well in excess of the industry.
Taking a look back first, the company's revenue growth last year wasn't something to get excited about as it posted a disappointing decline of 1.3%. Even so, admirably revenue has lifted 33% in aggregate from three years ago, notwithstanding the last 12 months. So we can start by confirming that the company has generally done a very good job of growing revenue over that time, even though it had some hiccups along the way.
Looking ahead now, revenue is anticipated to climb by 43% during the coming year according to the only analyst following the company. Meanwhile, the rest of the industry is forecast to only expand by 21%, which is noticeably less attractive.
In light of this, it's understandable that Sanxiang Advanced Materials' P/S sits above the majority of other companies. Apparently shareholders aren't keen to offload something that is potentially eyeing a more prosperous future.
What We Can Learn From Sanxiang Advanced Materials' P/S?
Typically, we'd caution against reading too much into price-to-sales ratios when settling on investment decisions, though it can reveal plenty about what other market participants think about the company.
Our look into Sanxiang Advanced Materials shows that its P/S ratio remains high on the merit of its strong future revenues. Right now shareholders are comfortable with the P/S as they are quite confident future revenues aren't under threat. It's hard to see the share price falling strongly in the near future under these circumstances.
Before you take the next step, you should know about the 2 warning signs for Sanxiang Advanced Materials that we have uncovered.
If you're unsure about the strength of Sanxiang Advanced Materials' business, why not explore our interactive list of stocks with solid business fundamentals for some other companies you may have missed.
New: Manage All Your Stock Portfolios in One Place
We've created the ultimate portfolio companion for stock investors, and it's free.
• Connect an unlimited number of Portfolios and see your total in one currency
• Be alerted to new Warning Signs or Risks via email or mobile
• Track the Fair Value of your stocks
Have feedback on this article? Concerned about the content? Get in touch with us directly. Alternatively, email editorial-team (at) simplywallst.com.
This article by Simply Wall St is general in nature. We provide commentary based on historical data and analyst forecasts only using an unbiased methodology and our articles are not intended to be financial advice. It does not constitute a recommendation to buy or sell any stock, and does not take account of your objectives, or your financial situation. We aim to bring you long-term focused analysis driven by fundamental data. Note that our analysis may not factor in the latest price-sensitive company announcements or qualitative material. Simply Wall St has no position in any stocks mentioned.
About SHSE:603663
Sanxiang Advanced Materials
Engages in the manufacture and sale of fused zirconia, cast modified materials, and single crystal fused aluminum materials.
Flawless balance sheet with moderate growth potential.
Market Insights

Advertisement
Community Narratives
MicroVision will explode future revenue by 380.37% with a vision towards success
Fair Value US$60.00|98.4% undervalued
TH
Community Contributor
The Indispensable Artery for a New North American Economy
Fair Value CA$132.87|1.3% undervalued
TI
Community Contributor