
Advertisement
- China
- /
- Metals and Mining
- /
- SHSE:603577
Not Many Are Piling Into Qingdao Huijintong Power Equipment Co.,Ltd. (SHSE:603577) Stock Yet As It Plummets 27%
Qingdao Huijintong Power Equipment Co.,Ltd. (SHSE:603577) shares have had a horrible month, losing 27% after a relatively good period beforehand. The drop over the last 30 days has capped off a tough year for shareholders, with the share price down 28% in that time.
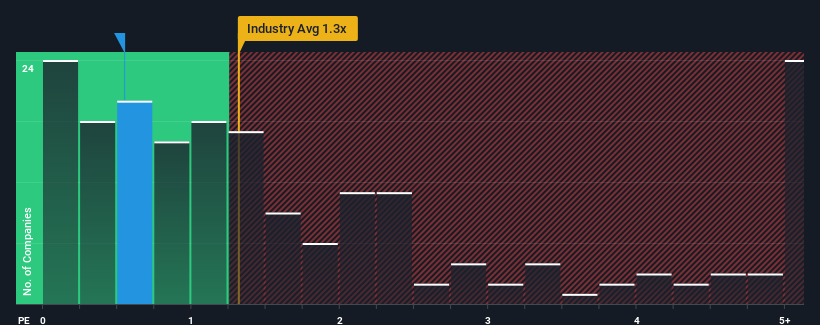
Although its price has dipped substantially, considering around half the companies operating in China's Metals and Mining industry have price-to-sales ratios (or "P/S") above 1.3x, you may still consider Qingdao Huijintong Power EquipmentLtd as an solid investment opportunity with its 0.5x P/S ratio. Nonetheless, we'd need to dig a little deeper to determine if there is a rational basis for the reduced P/S.
Check out our latest analysis for Qingdao Huijintong Power EquipmentLtd
How Qingdao Huijintong Power EquipmentLtd Has Been Performing
The revenue growth achieved at Qingdao Huijintong Power EquipmentLtd over the last year would be more than acceptable for most companies. Perhaps the market is expecting this acceptable revenue performance to take a dive, which has kept the P/S suppressed. If that doesn't eventuate, then existing shareholders have reason to be optimistic about the future direction of the share price.
We don't have analyst forecasts, but you can see how recent trends are setting up the company for the future by checking out our free report on Qingdao Huijintong Power EquipmentLtd's earnings, revenue and cash flow.How Is Qingdao Huijintong Power EquipmentLtd's Revenue Growth Trending?
In order to justify its P/S ratio, Qingdao Huijintong Power EquipmentLtd would need to produce sluggish growth that's trailing the industry.
If we review the last year of revenue growth, the company posted a worthy increase of 13%. The latest three year period has also seen an excellent 111% overall rise in revenue, aided somewhat by its short-term performance. Therefore, it's fair to say the revenue growth recently has been superb for the company.
When compared to the industry's one-year growth forecast of 13%, the most recent medium-term revenue trajectory is noticeably more alluring
With this information, we find it odd that Qingdao Huijintong Power EquipmentLtd is trading at a P/S lower than the industry. It looks like most investors are not convinced the company can maintain its recent growth rates.
What Does Qingdao Huijintong Power EquipmentLtd's P/S Mean For Investors?
Qingdao Huijintong Power EquipmentLtd's recently weak share price has pulled its P/S back below other Metals and Mining companies. Using the price-to-sales ratio alone to determine if you should sell your stock isn't sensible, however it can be a practical guide to the company's future prospects.
Our examination of Qingdao Huijintong Power EquipmentLtd revealed its three-year revenue trends aren't boosting its P/S anywhere near as much as we would have predicted, given they look better than current industry expectations. When we see robust revenue growth that outpaces the industry, we presume that there are notable underlying risks to the company's future performance, which is exerting downward pressure on the P/S ratio. At least price risks look to be very low if recent medium-term revenue trends continue, but investors seem to think future revenue could see a lot of volatility.
We don't want to rain on the parade too much, but we did also find 4 warning signs for Qingdao Huijintong Power EquipmentLtd (2 shouldn't be ignored!) that you need to be mindful of.
If strong companies turning a profit tickle your fancy, then you'll want to check out this free list of interesting companies that trade on a low P/E (but have proven they can grow earnings).
Valuation is complex, but we're here to simplify it.
Discover if Qingdao Huijintong Power EquipmentLtd might be undervalued or overvalued with our detailed analysis, featuring fair value estimates, potential risks, dividends, insider trades, and its financial condition.
Access Free AnalysisHave feedback on this article? Concerned about the content? Get in touch with us directly. Alternatively, email editorial-team (at) simplywallst.com.
This article by Simply Wall St is general in nature. We provide commentary based on historical data and analyst forecasts only using an unbiased methodology and our articles are not intended to be financial advice. It does not constitute a recommendation to buy or sell any stock, and does not take account of your objectives, or your financial situation. We aim to bring you long-term focused analysis driven by fundamental data. Note that our analysis may not factor in the latest price-sensitive company announcements or qualitative material. Simply Wall St has no position in any stocks mentioned.
About SHSE:603577
Qingdao Huijintong Power EquipmentLtd
Engages in the manufacture and sale of various galvanized and painted steel structures in China.
Solid track record with mediocre balance sheet.
Market Insights

Advertisement
Community Narratives
The company that turned a verb into a global necessity and basically runs the modern internet, digital ads, smartphones, maps, and AI.
Fair Value US$300.00|6.3% undervalued
OS
Community Contributor
Flowers Foods Pays A Fair Price For Health
Fair Value US$16.12|26.0% undervalued
NV
Community Contributor
TMX Group will thrive with 33.3% profit margin and enduring market moat
Fair Value CA$49.90|3.7% overvalued
LI
Community Contributor