Zhejiang Sanmei Chemical IndustryLtd's (SHSE:603379) 21% CAGR outpaced the company's earnings growth over the same three-year period


By buying an index fund, investors can approximate the average market return. But if you pick the right individual stocks, you could make more than that. For example, the Zhejiang Sanmei Chemical Industry Co.,Ltd. (SHSE:603379) share price is up 72% in the last three years, clearly besting the market decline of around 30% (not including dividends). On the other hand, the returns haven't been quite so good recently, with shareholders up just 43%, including dividends.
The past week has proven to be lucrative for Zhejiang Sanmei Chemical IndustryLtd investors, so let's see if fundamentals drove the company's three-year performance.
See our latest analysis for Zhejiang Sanmei Chemical IndustryLtd
There is no denying that markets are sometimes efficient, but prices do not always reflect underlying business performance. One imperfect but simple way to consider how the market perception of a company has shifted is to compare the change in the earnings per share (EPS) with the share price movement.
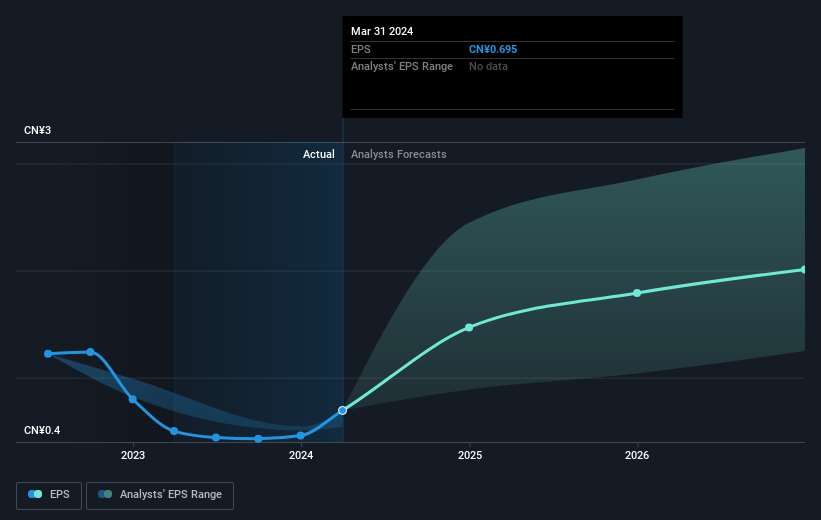
Zhejiang Sanmei Chemical IndustryLtd was able to grow its EPS at 31% per year over three years, sending the share price higher. The average annual share price increase of 20% is actually lower than the EPS growth. So one could reasonably conclude that the market has cooled on the stock. Of course, with a P/E ratio of 57.25, the market remains optimistic.
The image below shows how EPS has tracked over time (if you click on the image you can see greater detail).
It's probably worth noting that the CEO is paid less than the median at similar sized companies. It's always worth keeping an eye on CEO pay, but a more important question is whether the company will grow earnings throughout the years. Dive deeper into the earnings by checking this interactive graph of Zhejiang Sanmei Chemical IndustryLtd's earnings, revenue and cash flow.
What About Dividends?
When looking at investment returns, it is important to consider the difference between total shareholder return (TSR) and share price return. The TSR incorporates the value of any spin-offs or discounted capital raisings, along with any dividends, based on the assumption that the dividends are reinvested. It's fair to say that the TSR gives a more complete picture for stocks that pay a dividend. We note that for Zhejiang Sanmei Chemical IndustryLtd the TSR over the last 3 years was 76%, which is better than the share price return mentioned above. This is largely a result of its dividend payments!
A Different Perspective
It's nice to see that Zhejiang Sanmei Chemical IndustryLtd shareholders have received a total shareholder return of 43% over the last year. That's including the dividend. That's better than the annualised return of 8% over half a decade, implying that the company is doing better recently. Given the share price momentum remains strong, it might be worth taking a closer look at the stock, lest you miss an opportunity. While it is well worth considering the different impacts that market conditions can have on the share price, there are other factors that are even more important. For example, we've discovered 1 warning sign for Zhejiang Sanmei Chemical IndustryLtd that you should be aware of before investing here.
But note: Zhejiang Sanmei Chemical IndustryLtd may not be the best stock to buy. So take a peek at this free list of interesting companies with past earnings growth (and further growth forecast).
Please note, the market returns quoted in this article reflect the market weighted average returns of stocks that currently trade on Chinese exchanges.
Valuation is complex, but we're here to simplify it.
Discover if Zhejiang Sanmei Chemical IndustryLtd might be undervalued or overvalued with our detailed analysis, featuring fair value estimates, potential risks, dividends, insider trades, and its financial condition.
Access Free AnalysisHave feedback on this article? Concerned about the content? Get in touch with us directly. Alternatively, email editorial-team (at) simplywallst.com.
This article by Simply Wall St is general in nature. We provide commentary based on historical data and analyst forecasts only using an unbiased methodology and our articles are not intended to be financial advice. It does not constitute a recommendation to buy or sell any stock, and does not take account of your objectives, or your financial situation. We aim to bring you long-term focused analysis driven by fundamental data. Note that our analysis may not factor in the latest price-sensitive company announcements or qualitative material. Simply Wall St has no position in any stocks mentioned.
Have feedback on this article? Concerned about the content? Get in touch with us directly. Alternatively, email editorial-team@simplywallst.com
About SHSE:603379
Zhejiang Sanmei Chemical IndustryLtd
Zhejiang Sanmei Chemical Industry Co., Ltd.
Flawless balance sheet with reasonable growth potential.
